Download
1 / 20
200 likes | 318 Vues
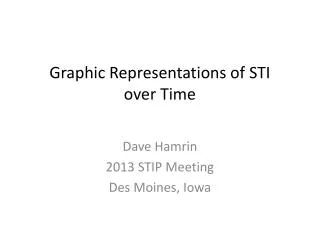
Graphic Representations of STI over Time. Dave Hamrin 2013 STIP Meeting Des Moines, Iowa. Background. A personal aside: I have a hard time throwing anything away I have a large collection of STI graphics This talk is a “greatest hits” version of that collection. “Over time…”.

E N D
Graphic Representations of STI over Time Dave Hamrin 2013 STIP Meeting Des Moines, Iowa
Background • A personal aside: I have a hard time throwing anything away • I have a large collection of STI graphics • This talk is a “greatest hits” version of that collection
“Over time…” • Do I mean the graphics originate over time, or do I mean the STI is over time? • I mean both.
The “circle of life” approach • For those of us who choose to chase the dream of life-cycle information management, a good STI graphic simply has to be circular. It’s an added bonus if two of the elements overlap. The following graphic I think came from a talk Joe Coyne gave at OSTI in the late 1980s.
The “gotta love linear” Approach • For those who think the “circle of life” approach is too much like juggling, the tried-and-true linear approach is preferred. The next graphic was obtained at an EPRI Electronic Publishing Workshop in Chicago in 1988. I don’t recall attending, but that in no way means I didn’t attend.
The “You Left Something Out” Approach • It seems the KISS approach actually offends some people. I imagine they are all poker players—”I’ll see you and raise you one!” The next graphic adds a layer.
I’ll see you, and raise you one (2) • The following graphic is from a book by Stephen Toulmin, although I don’t know which one. I’m sure hoping he was also the author of the previous figure, because it’s just a more complex version of the previous figure.
The “More is Better” Approach • In cognitive psychology, there is such a thing as the MEGO Effect—My Eyes Glaze Over. Normally, you try to AVOID the MEGO Effect. In the next graphic, the Royal Society in 1948 seems bent on INDUCING the MEGO Effect.
Seriously—What’s the Point? • For the most part, all these graphics are saying essentially the same basic things: • scientific knowledge is a process that occurs over time • Primary publication—aka publication in a peer-reviewed journal—is the Big Dog in the process
What’s a future STI graphic going to look like? • Some ideas • Preliminary = blogs, chat rooms, tweets, etc. • A bit less preliminary = talks at conference, postings follow the preliminary • Formal peer-reviewed publications
Bottom Line • I’ve been wrong before, but I believe that one part of the STI process will never change: • All preliminary steps will be considered “this is what I think” • Only after peer-reviewed publication will you be able to say “this is what I know”