Download
1 / 34
340 likes | 439 Vues
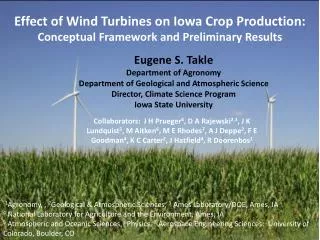
Study on how wind turbines affect crop production in Iowa, exploring microclimate changes and yield implications. Preliminary results show influences on wind speed, turbulence, and carbon flux. Conducted by Eugene S. Takle and collaborators from Iowa State University.

E N D
Effect of Wind Turbines on Iowa Crop Production: • Conceptual Framework and Preliminary Results Eugene S. Takle Department of Agronomy Department of Geological and Atmospheric Science Director, Climate Science Program Iowa State University Collaborators: J H Prueger4, D A Rajewski2,3, J K Lundquist5, M Aitken6, M E Rhodes7, A J Deppe2, F E Goodman4, K C Carter2, J Hatfield4, R Doorenbos1 1Agronomy, , 2Geological & Atmospheric Sciences, 3 Ames Laboratory/DOE, Ames, IA 4 National Laboratory for Agriculture and the Environment, Ames, IA 5 Atmospheric and Oceanic Sciences, 6Physics, 7 Aerospace Engineering Sciences: University of Colorado, Boulder, CO
Outline: • Motivation • Conceptual Model • Field Experiment • Preliminary Results • Low-Level Jet • Wind Shear • 2011 Field Campaign Photo courtesy of Lisa H Brasche
Motivation: Two Components • Public acceptance of wind turbines • Multi-use, high-land-value environment • Crops are tuned to climate conditions Do changes in temperature, humidity, wind speed, turbulence, and CO2 due to wind turbines influence crop growth and yield? • Testbed for validating high-resolution models of wind-farm performance and coupling to surface and PBL • General understanding of impacts of turbines • Understand turbine-turbine interaction and wind-farm performance • Options for further wind farm build-out: Go higher? More dense? • Iowa has a flat terrain, strong LLJ, not unlike coastal jets, many existing windfarms and component manufacturers: good zero-order testbed for off-shore technologies
What Turbine Density Optimizes Wind Power Production and Agricultural Production?
Turbine-Crop Interactions:Overview • Do turbines create a measureable influence on the microclimate over crops? • If so, is this influence create measureable biophysical changes? • And if this is so, does this influence affect yield? Agricultural shelterbelts have a positive effect on crop growth and yield. Will wind turbines also have a positive effect? Photo courtesy of Lisa H Brasche
Source: UniFly A/S Horns Rev 1 owned by Vattenfall. Photographer Christian Steiness.
Porté-Agel, Lu, and Wu, 2010 Wuβow, Sitzki, & Hahn, 2007, CFD simulation using ANSYS FLUENT 6.3 LES
Conceptual Model of Turbine-crop Interaction via Mean Wind and Turbulence Fields Speed recovery _____________________________________ day H2O CO2 Heat night
Field Experiment • Central Iowa wind farm (~100 1.3-MW turbines) • Southern edge of a wind farm • Corn-soybean cropping pattern (measurements made in corn) • 26 June – 7 September 2010; turbines off 0700 LST 26 July – 2300 LST 5 Aug 2300 • 4 Eddy Covariance flux towers • NREL/CU Lidar (J. Lundquist) (28 June-9 July)
4 flux towers • maize canopy • 26 June – 7 Sept, 2010 • CU/NREL Lidar • 28 June - 9 July 2010
Data analysis • Focus on ‘differences’ in crop microclimate at flux tower locations • Pay attention to wind direction • Turbines on – turbines off • Isolate instrument and location biases • Reference sonic temperature ~ 0.6-0.8oC high • possible influence from localized advection (large pond and wet field 1 km SE of the reference tower)
Wind speed comparison at 9 m Preliminary South wind: Turbines On NW wind: Turbines On South wind: Turbines Off NW wind: Turbines Off
Wind speed comparison at 9 m Preliminary South wind: Turbines On NW wind: Turbines On Daytime wind speed decrease South wind: Turbines Off NW wind: Turbines Off
Normalized TKE comparison at 6 m Preliminary South wind: Turbines On NW wind: Turbines On More turbulence at night South wind: Turbines Off NW wind: Turbines Off
u’w’ comparison at 6 m Preliminary South wind: Turbines On NW wind: Turbines On Higher nighttime surface stress South wind: Turbines Off NW wind: Turbines Off
Air temperature comparison at 9 m Preliminary South wind: Turbines On NW wind: Turbines On Cooler during day, warmer at night ? South wind: Turbines Off NW wind: Turbines Off
Carbon flux w’CO2’ around peak LAI Preliminary NW W NW W SW W SW W SW S SE Higher carbon uptake by crop behind turbines Higher nighttime respiration behind turbines 9 Jul 10 Jul 10 Jul 11 Jul
Summary • Preliminary analysis seemed to show a measureable influence of turbines on microclimate over crops. However • More in-depth analysis (wavelets, spectral analysis), more days of observation, different overall wind conditions shows more inconsistencies • Not sure that preliminary measurements represent general conditions
1800 LST 2200 LST 0200 LST 0800 LST 1800 LST 2200 LST 0200 LST 0800 LST Height above surface [m] Height above surface [m] Wind Speed [ms-1] Potential Temperature [K] The dynamics of the lower atmosphere are complex, especially at night Radiosonde profiles demonstrate that the cooling of the surface overnight is accompanied by dramatic accelerations in the winds Poulos, Blumen, Fritts, Lundquist, et al., 2002 Julie.Lundquist@nrel.gov
Models Don’t Capture Height of Jet Max Data courtesy of K. Carter and Adam Deppe, ISU Observations Models
Observed wind speed profiles (Windcubelidar, summer, midwest US) exhibit more variability than is traditionally considered in CFD LLJ Max ~ 16 m/s And these are “typical” midwestern conditions! LLJ Max ~ 12 m/s Turbine Wake Rhodes, Aitken, Lundquist, 2010, 2011 Julie.Lundquist@colorado.edu
Directional shear of 20 degrees across the rotor disk is common Considerable nocturnal directional shear And these are “typical” midwestern conditions! Rhodes, Aitken, Lundquist, 2010, 2011 Julie.Lundquist@colorado.edu
How valid are these off-shore estimates? It is much easier and less expensive to validate and improve models at on-shore sites
2011 Field Campaign • Same location • Measure from June-August • Six measurement stations (instead of 4); four provided by National Center for Atmospheric Research • Two lidars (one upwind, one downwind) • Wind Energy Science, Engineering and Policy Research Experience for Undergraduates: 10 openings, 260 applicants, 34 states, 70 women, 12 with 4.00 GPA. With such interest from young people wind energy has a bright future in Iowa!
Summary • We have fragmented evidence that turbines under some conditions are measurably influencing surface fluxes • Under overall weather conditions of 2010 we have no reason to expect a negative impact of turbines on crops, and there may be a positive effect • The 2011 field campaign will include more instruments and sensor placement to better observe turbine influences
ACKNOWLEDGMENTS Julie Lundquist for slides from presentation at LANL Dr. Ron Huhn, property owner Gene and Todd Flynn, farm operators Lisa Brasche for photos Equipment and personnel supplied by the National Laboratory for Agriculture and the Environment Funding supplied by Center for Global and Regional Environmental Research, University of Iowa MidAmerican Energy Company Ames Laboratory , Department of Energy National Science Foundation Photo courtesy of Lisa H Brasche
For More Information Eugene S. Takle gstakle@iastate.edu http://www.meteor.iastate.edu/faculty/takle/ 515-294-9871 Julie K. Lundquist Julie.Lundquist@colorado.edu Julie.Lundquist@nrel.gov http://atoc.colorado.edu/~jlundqui 303/492-8932 (@CU) 303/384-7046 (@NWTC) Photo courtesy of Lisa H Brasche