Understanding Crowding Through Recurrent Dynamics: Insights from Neural Modeling
This study explores the phenomenon of crowding, where the ability to distinguish objects diminishes in cluttered visual fields. Utilizing a Wilson-Cowan type neural model, the authors show that contrary to classic lateral inhibition predictions, adding more parallel lines can enhance performance under certain conditions. The paper presents a detailed analysis of spatial pooling and temporal dynamics, highlighting how model outputs reveal improved discrimination with long flankers compared to equal-length flankers. Crowding is reinterpreted as a complex interaction involving recurrent dynamics rather than solely lateral inhibition.

Understanding Crowding Through Recurrent Dynamics: Insights from Neural Modeling
E N D
Presentation Transcript
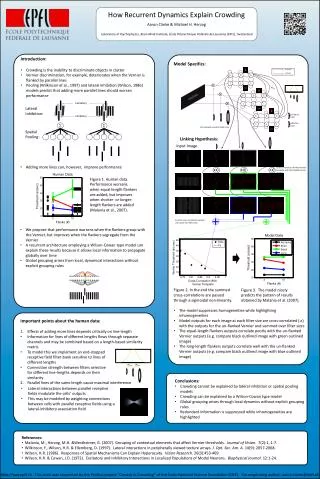
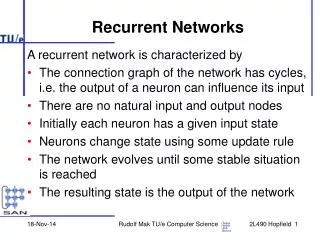
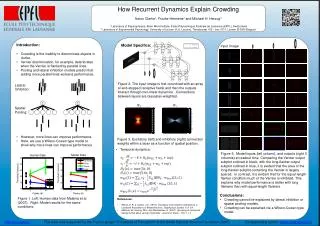
How Recurrent Dynamics Explain Crowding Aaron Clarke1, Frouke Hermens2 and Michael H. Herzog1 1 Laboratory of Psychophysics, Brain Mind Institute, École Polytechnique Fédérale de Lausanne (EPFL), Switzerland 2Laboratory of Experimental Psychology, University of Leuven (K.U. Leuven), Tiensestraat 102 – box 3711, Leuven B-3000 Belgium • Introduction: • Crowding is the inability to discriminate objects in clutter. • Vernier discrimination, for example, deteriorates when the Vernier is flanked by parallel lines. • Pooling and lateral inhibition models predict that adding more parallel lines worsens performance. Model Specifics: Input Image E E I I ⊗ ⊗ E E ⊗ I I E E I I Figure 2. The input image is first convolved with an array of end-stopped receptive fields and then the outputs interact through non-linear dynamics. Connections between layers are Gaussian-weighted. Lateral Inhibition: S S WE WI Spatial Pooling: 0.03 10 20 0.025 30 0.02 40 0.015 50 • However, more lines can improve performance. • Here, we use a Wilson-Cowan type model to show why more lines can improve performance. 60 0.01 Figure 3. Excitatory (left) and inhibitory (right) connection weights within a layer as a function of spatial position. 70 0.005 80 90 10 20 30 40 50 60 70 80 90 Figure 1. Left: Human data from Malania et al. (2007). Right: Model results for the same conditions. • Temporal dynamics: Figure 5. Model inputs (left column), and outputs (right 3 columns) at readout time. Comparing the Vernier output subplot outlined in black, with the long-flanker output subplot outlined in blue, it is evident that the area of the long-flanker subplot containing the Vernier is largely spared. In contrast, it is evident that for the equal-length-flanker condition much of the Vernier is inhibited. This explains why model performance is better with long flankers than with equal-length flankers. Excitatory Inhibitory • Conclusions: • Crowding cannot be explained by lateral inhibition or spatial pooling models. • Crowding can be explained via a Wilson-Cowan type model. E E E • References: • Wilson, H.R. & Cowan, J.D. (1972). Excitatory and Inhibitory Interactions in Localized Populations of Model Neurons. Biophysical Journal. 12:1-24. • Malania, M., Herzog, M.H. and Westheimer, G. (2007). Grouping of contextual elements that affect vernier thresholds. Journal of Vision. 7(2):1, 1-7. I I I http://lpsy.epfl.ch This work was supported by the ProDoc project "Processes of Perception" of the Swiss National Science Foundation (SNF) Corresponding author: aaron.clarke@epfl.ch