Understanding Crowding Through Recurrent Dynamics: Insights from Visual Processing Models
Crowding is the difficulty in distinguishing objects amidst visual clutter. This study investigates how performance in Vernier discrimination is affected by the presence of flanking lines. We propose a recurrent architecture that explains how local interactions lead to global grouping without explicit rules. Our findings reveal that the effect of flankers on performance is contingent on their length, demonstrating that shorter or longer flankers can enhance performance while equal-length ones degrade it. This model highlights the importance of dynamic interactions in visual perception.

Understanding Crowding Through Recurrent Dynamics: Insights from Visual Processing Models
E N D
Presentation Transcript
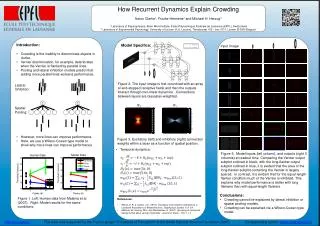
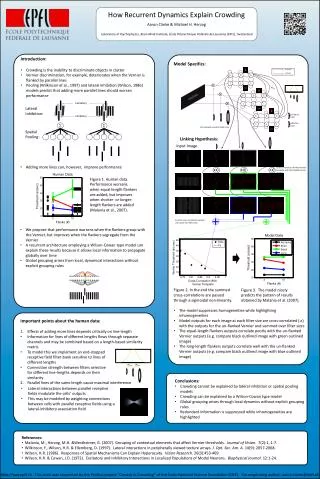
How Recurrent Dynamics Explain Crowding Aaron Clarke & Michael H. Herzog Laboratory of Psychophysics, Brain Mind Institute, École Polytechnique Fédérale de Lausanne (EPFL), Switzerland • Introduction: • Crowding is the inability to discriminate objects in clutter • Vernier discrimination, for example, deteriorates when the Vernier is flanked by parallel lines • Pooling (Wilkinson et al., 1997) and lateral inhibition (Wilson, 1986) models predict that adding more parallel lines should worsen performance Model Specifics: Excitatory Inhibitory E E I I ⊗ •X •X •X WBtw ⊗ E E ⊗ I I Excitatory Lateral Inhibition: Excitatory Layer E E Inhibitory S S Inhibitory Layer I I End-stopped receptive field array Spatial Pooling: Linking Hypothesis: Input Image • Adding more lines can, however, improve performance Cross-correlate un-flanked Vernier template with the flanked Vernier images Figure 1. Human data. Performance worsens when equal-length flankers are added, but improves when shorter- or longer-length flankers are added (Malania et al., 2007). Model Data Human Data 60 60 No flanks Short 50 50 Equal Long 40 40 Threshold (arcsec) Threshold (arcsec) 30 30 20 20 Sum the cross-correlation outputs over space and filter sizes 10 10 2 16 2 16 Flanks (#) Flanks (#) • We propose that performance worsens when the flankers group with the Vernier, but improves when the flankers segregate from the Vernier • A recurrent architecture employing a Wilson-Cowan type model can explain these results because it allows local information to propagate globally over time • Global grouping arises from local, dynamical interactions without explicit grouping rules 45 Data Fit 40 E E E 35 30 I I I Vernier Threshold (arc sec) 25 20 15 0.75 0.8 0.85 0.9 0.95 1 Cross-Correlation With Vernier Template Figure 2. In the end the summed cross-correlations are passed through a sigmoidal non-linearity. Figure 3. The model nicely predicts the pattern of results obtained by Malania et al. (2007). • The model suppresses homogeneities while highlighting inhomogeneities • Model outputs for each image at each filter size are cross-correlated (.x) with the outputs for the un-flanked Vernier and summed over filter sizes • The equal-length flankers outputs correlate poorly with the un-flanked Vernier outputs (e.g. compare black outlined image with green outlined image) • The long-length flankers outputs correlate well with the un-flanked Vernier outputs (e.g. compare black outlined image with blue outlined image) • Important points about the human data: • Effects of adding more lines depends critically on line-length • Information for lines of different lengths flows through separate channels and may be combined based on a length-based similarity metric • To model this we implement an end-stopped receptive field filter-bank sensitive to lines of different lengths • Connection strength between filters selective for different line-lengths depends on their similarity WBtw WBtw • Conclusions: • Crowding cannot be explained by lateral inhibition or spatial pooling models • Crowding can be explained by a Wilson-Cowan type model • Global grouping arises through local dynamics without explicit grouping rules • Redundant information is suppressed while inhomogeneities are highlighted Parallel lines of the same length cause maximal interference • Lateral interactions between parallel receptive fields modulate the cells’ outputs • This may be modeled by weighting connections between cells with parallel receptive fields using a lateral-inhibitory association field • References: • Malania, M., Herzog, M.H. &Westheimer, G. (2007). Grouping of contextual elements that affect Vernier thresholds. Journal of Vision. 7(2):1, 1-7. • Wilkinson, F., Wilson, H.R. & Ellemberg, D. (1997). Lateral interactions in peripherally viewed texture arrays. J. Opt. Soc. Am. A. 14(9): 2057-2068. • Wilson, H.R. (1986). Responses of Spatial Mechanisms Can Explain Hyperacuity. Vision Research. 26(3):453-469. • Wilson, H.R. & Cowan, J.D. (1972). Excitatory and Inhibitory Interactions in Localized Populations of Model Neurons. Biophysical Journal. 12:1-24. http://lpsy.epfl.ch This work was supported by the ProDoc project “Crowds in Crowding" of the Swiss National Science Foundation (SNF) Corresponding author: aaron.clarke@epfl.ch