Download
1 / 30
300 likes | 472 Vues
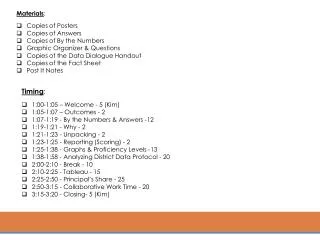
Materials : Copies of Posters Copies of Answers Copies of By the Numbers Graphic Organizer & Questions Copies of the Data Dialogue Handout Copies of the Fact Sheet Post It Notes. Timing : 1:00-1:05 – Welcome - 5 (Kim) 1:05-1:07 – Outcomes - 2

E N D
Materials: • Copies of Posters • Copies of Answers • Copies of By the Numbers • Graphic Organizer & Questions • Copies of the Data Dialogue Handout • Copies of the Fact Sheet • Post It Notes • Timing: • 1:00-1:05 – Welcome - 5 (Kim) • 1:05-1:07 – Outcomes - 2 • 1:07-1:19 - By the Numbers & Answers -12 • 1:19-1:21 - Why - 2 • 1:21-1:23 - Unpacking - 2 • 1:23-1:25 - Reporting (Scoring) - 2 • 1:25-1:38 - Graphs & Proficiency Levels -13 • 1:38-1:58 - Analyzing District Data Protocol - 20 • 2:00-2:10 - Break - 10 • 2:10-2:25 - Tableau - 15 • 2:25-2:50 - Principal’s Share - 25 • 2:50-3:15 - Collaborative Work Time - 20 • 3:15-3:20 - Closing- 5 (Kim)
OECD Test For Schools WorkshopSeptember 2014 Take an opportunity to look at the sample questions posted around the room
Outcomes • Develop a deeper understanding of the OECD Test for Schools and the type of questions tested • Identify strategies to “unpack” the school report and understand various graphs • Engage in a data dialogue protocol to analyze district data • Determine next steps and plan for the use of your school data
By the Numbers Work with the people at your table to determine which number from the number bank accurately completes each statement.
The OECD Test for Schools was piloted in 2013 in 105 schools across the US. There were 10 FCPS schools involved. The age of the student who takes the assessment is 15. The OECD Test for Schools data is comparable to existing Programme for International Student Assessment (PISA) scales. The international PISA results are published every 3years. 75 is the suggested minimum target number of students tested at each school. Average number of FCPS students at a school who took the assessment in 2013-14 school year is 64. Answers
For the OECD Test for Schools, students respond to approximately 2 hours of test questions in reading, mathematics and science and answer a 30 minute student questionnaire that is an important part of the assessment. The total percentage of simple multiple choice items on the mathematics, reading and science test 34% . Besides the mean average score, schools receive information about the percentage of students who performed in each of the 6proficiency levels. Predict the FCPS Mean Performance Scores for 2013: Mathematics: 524 Reading: 523 Science: 531 Answers Continued
Why? • Provides student comparisons to same-age students in the United States and internationally while considering socioeconomic factors • Assesses critical thinking, problem-solving and written communication skills • Offers insight into student attitudes and the teaching and learning environment at your school
Unpacking the School Report • Academic Reports • Reading • Mathematics • Science • Student Engagement & Learning Environment • Disciplinary Climate • Teacher-Student Relations • Reading Habits • Motivation & Self-Efficacy • Academic Comparisons • Within the United States • Internationally
Reporting of Scores • Reporting is shown in two ways: • Mean score • Proficiency Levels
*For descriptors of the six Proficiency Levels see p. 37, 42 & 45
*For more information about how to read bubble charts see p. 71
*Descriptors of each profile are located on p. 58 in your report
Your School Report Take a few minutes to look at your school report • With Post Its, flag any graphs and charts that you may want to revisit
Analyzing District Data • Student Performance • Local Context • National and International Context • Reader Profile • Learning Environment • Teacher-Student Relationships
District Data – Reader Profile See pg. 9 of 15
Data Dialogue Activity • What are some categories, patterns, or trends that are emerging? • What is surprising or unexpected? • What are some inferences, explanations or conclusions we might draw from data ? • What other data sources might we want to explore?
We will begin again at 2:20 Take an opportunity to look at the sample questions posted around the room
Support & Resources • Tableau • Ed Leader 21 Toolkit • FCPS Website
Collaboration Time Work independently, with your school team, or collaborate with other principals to: • Unpack your report • Look at the district report more closely • Share ideas • Start your communication and action plan