Download
1 / 10
100 likes | 253 Vues
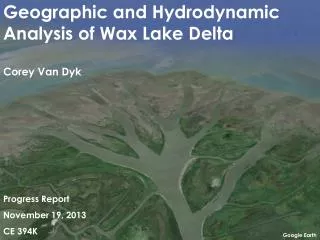
Flow analysis on Pintail island, Wax Lake D elta. Alicia Sendrowski November 19, 2013 GIS in water resources CE394K.3. Wax Lake Delta, Louisiana. 140 km southwest of New Orleans Deltaic system that is building land Interested in island hydrodynamics

E N D
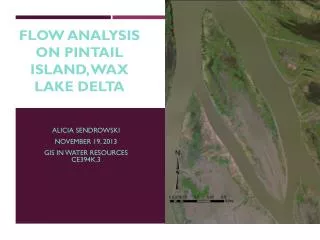
Flow analysis on Pintail island, Wax Lake Delta Alicia Sendrowski November 19, 2013 GIS in water resources CE394K.3
Wax Lake Delta, Louisiana • 140 km southwest of New Orleans • Deltaic system that is building land • Interested in island hydrodynamics • Tracer study: sensors set up around island to detect Rhodamine dye in order to measure travel time on Pintail island • Tests done for falling tide and rising tide in 2 arrangements Pintail Island http://www.mississippiriverdelta.org/blog/files/2011/09/waxlake1.jpg
Tracer Study 1: Sensors D, E, G • First arrangement • Falling tide • Added 160mL of Rhodamine dye • Results: • Tracer moves from Injection Point to Sensor E and then to G.
Time series breakdown 4:55 PM 4:59 PM 4:43 PM 5:07 PM 5:11 PM 5:05 PM
Results • The peak of Sensor E comes at ~ 14 minutes after injection • Sensor G peak ~ 11 minutes after sensor E detection • Sensors have detection limit of 200 µg/L • Zoomed in, there is some dispersion • Total travel time was 25 minutes • Distance between Injection point and Sensor G ~ 184 m
Tracer Study 2: Sensors C, B, A • Arrangement 2 • Rising tide then falling tide • 310 mL of Rhodamine Dye
Results • First peak comes 43 minutes after injection for Sensor C • Tide begins to fall and another peak occurs 66 minutes after the first peak for Sensor C • Sensor B sees peak 181 minutes after injection • Sensor A also detects rhodamine but very dispersed • Much more dispersion than first test
Future Work • Objective 1 • Input time series for Tracer study 3 • Same arrangement as 2nd tracer study but for falling tide only • Further analysis into all tracer results to obtain characteristics about Pintailisland hydrology • Objective 2 • Use results from tracer studies on Pintail Island to suggest sensor locations for Mike Island tracer study Mike Island
Acknowledgments • Dr. Paola Passalacqua • Matt Hiatt • Research Group https://www.nwf.org/~/media/Content/Environmental%20Issues/Flooding/WaxLakeDelta2_CraigGuillot_219X219.ashx
QUESTIONS? http://lab.visual-logic.com/wp-content/uploads/2010/02/wax-lake-delta.jpg