Understanding Nonparametric Statistics: Chi-Square Tests and Their Applications
In Chapter 16, we explore the realm of nonparametric statistics, focusing on Chi-Square tests and their applications. Learn when to utilize these tests to analyze data that doesn't meet parametric assumptions. This chapter covers the fundamental concepts of Chi-Square tests, including one-sample goodness-of-fit and two-sample tests, alongside the critical hypotheses needed for analysis. Additionally, discover how to compute Chi-Square values, interpret results, and the significance of p-values. Gain valuable insights into using SPSS for Chi-Square calculations and other nonparametric tests.

Understanding Nonparametric Statistics: Chi-Square Tests and Their Applications
E N D
Presentation Transcript
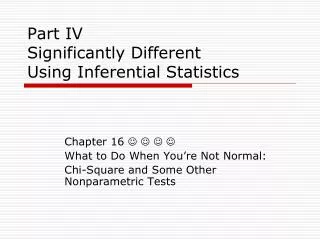
Part IVSignificantly DifferentUsing Inferential Statistics Chapter 16 What to Do When You’re Not Normal: Chi-Square and Some Other Nonparametric Tests
What you will learn in Chapter 16 • A brief survey of nonparametric statistics • When they should be used • How they should be used
Introduction • Parametric statistics have certain assumptions • Variances of each group are similar • Sample is large enough to represent the population • Nonparametric statistics don’t require the same assumptions • Allow data that comes in frequencies to be analyzed…they are “distribution free”
One-Sample Chi-Square • Chi-square allows you to determine if what you observe in a distribution of frequencies is what you would expect to occur by chance. • One-sample chi-square (goodness of fit test) only has one dimension • Two-sample chi-square has two dimensions
Computing Chi-Square • What do those symbols mean?
More Hypotheses • Null hypothesis • Research hypothesis
So How Do I Interpret… • x2(2) = 20.6, p < .05 • x2 represents the test statistic • 2 is the number of degrees of freedom • 20.6 is the obtained value • p < .05 is the probability
Using the Computer • One-Sample Chi Square using SPSS
SPSS Output • What does it all mean?
Glossary Terms to Know • Parametric • Nonparametric • One-sample Chi Square