Download
1 / 17
170 likes | 302 Vues
Chapter 12 explores the concept of Analysis of Variance (ANOVA), essential for comparing means across multiple groups. You will learn when to apply ANOVA, how to compute and interpret the F-statistic, and utilize SPSS for analysis. The chapter covers one-way ANOVA, factorial designs, and hypotheses testing, emphasizing the importance of group variance comparison. We will illustrate the method with practical examples, like GRE scores across different ethnicities, and explain post-hoc comparisons for further insights.

E N D
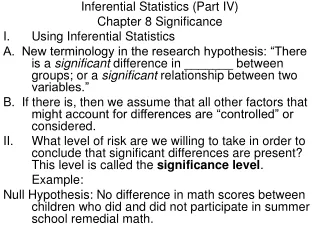
Part IVSignificantly DifferentUsing Inferential Statistics Chapter 12 Two Groups Too Many? Try Analysis of Variance (ANOVA)
What you will learn in Chapter 12 • What Analysis of Variance (ANOVA) is and when it is appropriate to use • How to compute the F statistic • How to interpret the F statistic • How to use SPSS to complete an ANOVA • single factor design
Analysis of Variance (ANOVA) • Used when more than two group means are being tested simultaneously • Group means differ from one another on a particular score / variable • Example: DV = GRE Scores & IV = Ethnicity • Test statistic = F test • R.A. Fisher, creator
Path to Wisdom & Knowledge • How do I know if ANOVA is the right test?
Different Flavors of ANOVA • ANOVA examines the variance between groups and the variances within groups • These variances are then compared against each other • Similar to t Test…only in this case you have more than two groups • One-way ANOVA • Simple ANOVA • Single factor (grouping variable)
More Complicated ANOVA • Factorial Design • More than one treatment/factor examined • Multiple Independent Variables • One Dependent Variable • Example – 3x2 factorial design
Computing the F Statistic • Rationale…want the within group variance to be small and the between group variance large in order to find significance.
Hypotheses • Null hypothesis • Research hypothesis
One-Way ANOVA • Computing the Important Values
Source Table Note: F value for two group is the same at t2
Degrees of Freedom (df) • Numerator • Number of groups minus one • k-1 • 3 groups --- 3 – 1 = 2 • Denominator • Total number of observations minus number of groups • N-K • 30 participants – 3 = 27 Represented: F (2, 27)
How to Interpret • F (2,27) = 8.80, p < .05 • F = test statistic • 2,27 = df between groups & df within groups • {Ah ha…3 groups and 30 total scores examined} • 8.80 = obtained value • Which we compared to the critical value • p < .05 = probability less than 5% that null hypothesis is true • Meaning the obtained value is GREATER than the critical value
Omnibus Test • F test is an “omnibus test” and only tells you that a difference exist • Must conduct follow-up t tests to find out where the difference is… • BUT…Type I error increases with every follow-up test / possible comparison made • 1 – (1 – alpha)k • Where k = number of possible comparisons
Using the Computer • SPSS and the One-Way ANOVA
SPSS Output • What does it all mean?
Glossary Terms to Know • Analysis of variance • Simple ANOVA • One-way ANOVA • Factorial design • Omnibus test • Post Hoc comparisons • Source table