Understanding Confidence Intervals for Population Proportions
This guide explores confidence intervals for population proportions, showcasing how to calculate point estimates (p-hat) for proportions of successes and failures in a sample. For reliable statistical analysis, conditions such as np ≥ 5 and nq ≥ 5 must be met for normality in the sampling distribution. Examples include surveys on public opinion regarding military withdrawal from Afghanistan, household gun ownership, and more. Learn to construct confidence intervals effectively and determine the minimum sample sizes needed for accurate estimations.


Understanding Confidence Intervals for Population Proportions
E N D
Presentation Transcript
Section 6.3 Confidence Intervals for Population Proportions
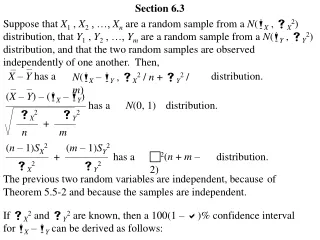
The point estimate for p, the population proportion of successes is given by the proportion of successes in a sample (Read as p-hat) is the point estimate for the proportion of failures where If np 5 and nq 5 , the sampling distribution for is normal. Confidence Intervals forPopulation Proportions
Calculating A random sample of 1433 cars showed that 388 of them were more than 10 years old. What is the ?
Calculating 1000 likely voters were surveyed about their opinions on the war in Afghanistan. 520 voters thought that the US should withdraw from Afghanistan within a year. Find . Out of 855 voters, 530 said that the US should not get directly involved in the conflict in Libya. What is the ?
The maximum error of estimate, E for a c-confidence interval is: A c-confidence interval for the population proportion, p is Confidence Intervals for Population Proportions
Confidence Interval for p • Out of 1000 likely voters, 520 supported withdrawing UStroops from Afghanistan. Construct a 99% confidence interval. Step 1: Find the point estimate for p. = 0.52 Step 2: Find Step 3: Check to see if np 5 and nq 5 1000(0.52) 5 and 1000(0.48) 5, so the sampling normal.
Step 4: The maximum error of estimate, E. Step 5: Construct the confidence interval. 0.52 – 0.031 < p < 0.52 + 0.031 0.489 < p < 0.551 With 95% confidence, you can say the proportion of US voters that want the US to withdraw from Afghanistan is between 0.489 and 0.551.
277 U.S. adults, in a survey of 1026 U.S. adults, would prefer to have a girl if they could only have one child. Construct a 95% confidence interval for the proportion of adults who say that they would prefer to have a girl if they could only have one child.
Warm Up Of 1418 high school baseball players, 93 suffered an injury while playing the sport. Construct a 99% confidence interval for the population proportion.
If you do not have a preliminary estimate, use 0.5 for both Minimum Sample Size If you have a preliminary estimate for p and q the minimum sample size given a c-confidence interval and a maximum error of estimate needed to estimate p is:
With no preliminary estimate, use 0.5 for Example-Minimum Sample Size • You wish to estimate the proportion of fatal accidents that are alcohol related at a 99% level of confidence. Find the minimum sample size needed to be accurate to within 2% of the population proportion. = You will need at least 4161 for your sample.
Example-Minimum Sample Size • You wish to estimate the proportion of fatal accidents that are alcohol related at a 99% level of confidence. Find the minimum sample size needed to be be accurate to within 2% of the population proportion. Use a preliminary estimate of p = 0.235 With a preliminary sample you need at least n= 2992 for your sample.
You are running a political campaign and wish to estimate, with 95% confidence, the proportion of registered voters who will vote for your candidate. What is the minimum sample size needed if you are to be accurate within 3% of the population proportion?
Class work #1 1. A survey of 250 households showed 62 owned at least one gun. Construct a 90% confidence interval for the proportion of households that own at least one gun. 2. A survey of 2450 golfers showed that 281 of them are left-handed. Construct a 92% confidence interval for the proportion of golfers that are left-handed. 3. A pollster wishes to estimate the proportion of United States voters who favor capital punishment. How large a sample is needed in order to be 90% confident that the sample proportion will not differ by more than 4%? • You are running a political campaign and wish to estimate, with 95% • confidence, the proportion of registered voters who will vote for your candidate. • What is the minimum sample size needed if you are to be accurate within 7% of • the population proportion? Use a preliminary estimate of p = 0.62