Download

1 / 53
540 likes | 571 Vues
This session covers fundamentals of microeconomic analysis, economic choices, market notions, demand and supply laws, and price determination and equilibrium. Explore the basics and key concepts of economic analysis with practical applications and insights for decision-making and interactions in the market. Gain knowledge on the determinants of demand, supply, and elasticity, and their implications in economic systems. Discover the methodology used in analyzing economic issues, the role of prices in economic growth, and the functioning of markets in resolving production and exchange dilemmas. Enhance your understanding of human wants, scarcity, economic resources, and the essential role of prices, government, and institutions in the economic framework.

E N D
Fundamental Concepts & Basic Framework of Demand and Supply: Prof. Samar K. Datta Session 1 28th June, 2007
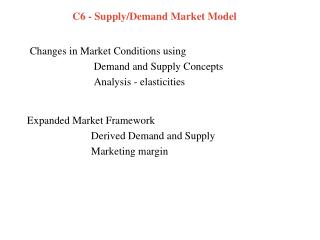
Materials intended to be covered in this session • Objectives of EA – fundamentals of microeconomic analysis • Concerns of micro & macro-economics • Race between human wants & scarcity of economic resources giving rise to the fundamental economic choice problem • Functions of an economic system – role of prices, government & institutions • Notion of market • The demand side • Law of demand • Factors affecting demand • Features of a market demand curve • Movement along & off (i.e., shift of) the demand curve • The supply side • Law of supply • Factors affecting supply • Features of a supply curve • Movement along & off the supply curve • Price determination through interaction between demand & supply • Existence & stability of equilibrium • Shifts in demand & supply • Concepts of point & arc elasticity; Price, income & cross elasticity of demand; Certain properties of elasticity • Some applications & food for thought
Objectives of EA etc. • Why EA dealing with micro-economics? • Perhaps the most important component of any business analysis, providing clues towards answering a whole lot of questions; • Provides insights thro’ analysis of decision-making process by economic agents and their interaction with the market • Provides basis for a number of applied fields in management • Distinctive feature of micro-economics vis-à-vis macro-economics: • Macro dealing with behavior of aggregative variables like price, income, employment, money supply, exchange rate etc.
Fundamental issue & methodology used • Race between human wants & scarce economic resources – land, labor, capital and entrepreneurial skill • Example, asking a poor man about his demand for credit: why does he specify his demand as a very large number, a small number & even a zero, depending upon how we pose the question? What are his wants and demand? • Broad methodology used: • Marginal analysis; • Positive rather than normative analysis; • Trade off involved in most choices • Question: Why heath care expenses increasing steadily in the US?
Functioning of an economic system • Role of prices in resolving issues like what to produce & for whom to produce (i.e., issues on marketing), how to produce (i.e., issues on technology & institutions) • Role of prices (interest, wages, rent, profit etc.) in fostering economic growth • Can prices ensure rationing over time & achieve sustainability? • Is there any role for government and other institutions?
The Market • A market is an institutional arrangement under which buyers and sellers can voluntarilyexchange some quantity of a good or service at a mutually agreeable price. • It can, but need not be a specific place or location where buyers and sellers actually come face to face for the purpose of transacting their business – e.g. market for professors has no physical location
The Concept of Demand • Human wants are all the goods, services, and conditions of life that individuals desire (i.e., has use value) • Demand in economics is want backed by purchasing power (note difference between effective demand and notional demand) • A consumer’s claim on a good/service is recognized by the producer only if it is backed by sufficient purchasing power
Law of Demand & the Market Demand Curve • Other things remaining the same, the quantity demanded of a commodity is inversely related to its price. • A lower price may encourage existing consumers to consume larger quantities • Also, other consumers who were previously unable to afford the commodity may now begin consuming it • The market demand curve • refers to the behavior of an aggregate of economic agents • over a given period of time • while holding constant all other relevant economic variables on which demand depends (ceteris paribus assumption) • On the presumption that different units of the commodity are homogeneous (else weights of product composition to be taken into consideration)
Example: Demand For Ice Cream Demand Price of Ice Cream Interpret points above & below the demand curve Quantity of Ice Cream
Ceteris Paribus . . . ...implies that all the relevant variables (e.g. determinants of demand) are held constant, except the one(s) being studied at the time. Among other variables held constant are consumers’ incomes, tastes and preferences, prices of related commodities (substitutes and complements), number of consumers in the market, weather, future expectations, etc.
Determinants of Demand • Market Price • Consumer Income • Prices of Related Goods • Tastes • Expectations • Number of Consumers
Determinants of Demand: Market Price P Law of Demand: There exists an inverse relationship between Price and Quantity Demanded. Q
Determinants of Demand: Income P • As income increases, the demand for a normal goodwill increase. Q
Determinant of Demand: Income P • As income increases, the demand for an inferior gooddecreases (e.g., in case of coarse cereals). Q
Determinants of Demand: Prices of Related Goods When the fall in price of one good reduces the demand for another good, the two goods are substitutes.
Determinants of Demand: Prices of Related Goods When the fall in price of one good increases the demand for another good, the two goods are complements.
Determinants of Demand: Tastes & preferences, consumer expectations of future income & price • Advertisement, for example, may shift up demand. • Expectations of future income rise or price rise may shift up current demand.
Demand function general form • Qx = function of • Px (own price) (-) • Pz (price of related goods) (+/-) • Y (consumer income) (+/-) • N (size of population) (+) • α (tastes/preferences) (+/-) • Pe/P or Ye/Y (expectations about future price or income) (+/-)
Demand Schedule and Demand Curve • Demand Schedule: A table that shows the relationship between the price of the good and the quantity demanded QxPx 100 1 50 2 20 3 • Demand Curve: The downward-sloping line relating price and quantity demanded
Movements vs. Shifts in the Demand Curve • Change in Quantity Demanded Movement along the demand curve caused by a change in the market price of the product. • Change in Demand A shift in the demand curve, either to the left or right i.e. a change in the quantity demanded at each commodity price • The demand curve shifts when there is a change in (a) consumers’ incomes, (b) tastes and preferences, (c) prices of related commodities, and (d) number of consumers in the market, etc.
Changes in Quantity Demanded Price $2.00 $1.00 Quantity 7 13
Change in Demand Price $2.00 Quantity 7 10
GEOMETRIC FEATURES OF A DEMAND CURVE • Its level, depending on role of non-price factors (interpret intercepts on both axes) • Its shape – i.e., inverse relationship, decided by law of demand • Its slope, is decided by units of P & Q (the curve becoming flatter with rise in unit of Q or P), the reference period (usually flatter in long run), &role of non-price factors (e.g., flatter for luxury goods) • Its curvature – can be concave, convex, straight lineor a combination (theory proving no further clue)
The Concept of Supply. P Quantity Suppliedrefers to the amount (quantity) of a good that sellers are willing and able to make available for sale at alternative prices in a given point in time. Interpret points above & below the supply curve Q
Determinants of Supply • Market price (+) • Input prices (-) • Cheaper technology (+) • Price of alternative goods (-) • Government tax (-) or subsidy (+) • Expectations of future price rise (-) • Number of Producers (+)
Determinant of Supply: Market Price P Law of Supply There exists an direct (positive) relationship between Price and Quantity Supplied. Q
Interpreting features of a supply curve • Level/intercept • Direction • Slope • Curvature
Change in quantity supplied verses change in supply • Change in Quantity Supplied Movement along the supply curve, caused by a change in the market price of the product. • Change in Supply A shift in the supply curve, either to the left or right.
Supply: Schedule and Curve • Supply Schedule A table that shows the relationship between the price of the good and the quantity supplied. • Supply Curve The upward-sloping line relating price and quantity supplied.
Changes in Quantity Supplied Price $2.00 $1.00 Quantity 1 7
Change in Supply Price $2.00 Quantity 7 11
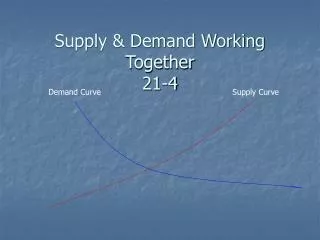
Supply and Demand Together • Equilibrium Price is oneat which the supply and demand curve intersect (i.e., D=S) (assimilating interests of two conflicting groups thro’ negotiation & adjustment in terms of price) • Generally, there is one stable equilibrium, as shown in next slide. • However, adjustments may not always lead to a stable equilibrium (i.e., convergence). • Moreover, there may be multiple equilibrium, some of which may not be fully stable, as we shall see shortly.
Forces of Demand and Supply At RestMarket Equilibrium Price $2.00 Quantity 7
Actions of buyers and sellers that move toward equilibrium. • Excess Supply Price is above equilibrium price, therefore producers are unable to sell all they want at the going price. • Excess Demand Price is below equilibrium price, therefore consumers are unable to buy all they want at the going price.
Actions of buyers and sellers that move toward equilibrium. Price Excess Supply Quantity
Actions of buyers and sellers that move toward equilibrium. Price Excess Demand Quantity
Stability of Market Equilibrium The backward bending supply curve of labor may cause multiple equilibrium - some unstable (e.g. at A), some stable (e.g., at B).
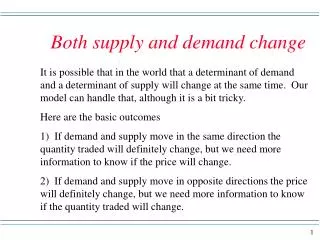
Comparative Statics: Analyzing Changes in Equilibrium • Determine if event shifts supply curve, the demand curve, or both. • Determine if curve(s) shift to left or right. • Determine how shift affects equilibrium price and quantity. • Example: Demand for ice cream given hot weather.
Change in demand for ice cream due to hot weather Price New Equilibrium Pe Pe Quantity Qe Qe
A point to note • For analytical convenience, an artificial dichotomy is created between producers and consumers; and demand and supply • Very often in the real world, producers and consumers are either • the same person e.g. a farmer who eats his own crop, or • play both roles simultaneously – a person who produces one product, consumes others • Also, demand and supply may be dependent on each other – e.g. generation of income during production may expand the customer base for the product e.g. workers in Ford buying the Ford motor car.
Price Elasticity of Demand • Price elasticity of demand measures the percentage change in the quantity demanded resulting from a 1-percent change in price.
Price Elasticity andConsumer Expenditure Demand If Price Increases, If Price Decreases, Expenditures: Expenditures: Inelastic (Ep<1)Increase Decrease Unit Elastic (Ep = 1) Unchanged Unchanged Elastic (Ep >1) Decrease Increase
Point Elasticity of Demand • Point elasticity measures elasticity at a point on the demand curve. • Its formula is:
Problems Using Point Elasticity • We may need to calculate price elasticity over portion of the demand curve rather than at a single point. • The price and quantity used as the base will alter the price elasticity of demand (point elasticity of demand is not symmetric).
Arc Elasticity of Demand • Arc elasticity calculates elasticity over a range of prices • Its formula is:
Income Elasticity of Demand • Income elasticity of demand measures the percentage change in the quantity demanded resulting from a 1-percent change in income. • Its formula is:
Type of Good Normal Good Necessity Luxury Inferior Good Income Elasticity of Demand and type of Good • Income Elasticity • Positive • 0 < e < 1 • e > 1 • Negative
Cross-price Elasticity of Demand • Cross-price elasticity of demand measures the percentage change in the quantity demanded of good Y resulting from a 1-percent change in price of good X. • Its formula is: