Understanding Multiple Regression: Models, Expectations, and Applications in Data Analysis
This guide delves into the fundamentals of multiple regression, outlining how to evaluate the cumulative effects of several independent variables on a dependent variable. It explains the transformation of linear models, the general form of multiple regression, and the steps involved in hypothesizing a model, estimating parameters, validating assumptions, and using the model for prediction. With practical examples like house price prediction based on various factors, this resource equips you with the knowledge to utilize multiple regression effectively in data analysis.

Understanding Multiple Regression: Models, Expectations, and Applications in Data Analysis
E N D
Presentation Transcript
THE MULTIPLE REGRESSION MODEL
MULTIPLE REGRESSION • In a multiple regression we are trying to evaluate the cumulative effects that changes to more than one independent variable (x1, x2, x3, etc.) or will have on a dependent variable (y)
Transformations to a Linear Model • Multiple regression can used to evaluate models like: y = 0 + 1 x1 + 2 x2 + 3 x12 + 4 x1x2+ 5 x1/x2 + 6 logx1 + • Define • x3 = x12 • x4 = x1 x2 • x5 = x1/x2 • x6 = log x1 • Then the model becomes: y = 0 + 1 x1 + 2 x2 + 3 x3 + 4 x4 + 5 x5 + 6x6 +
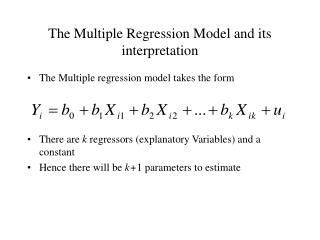
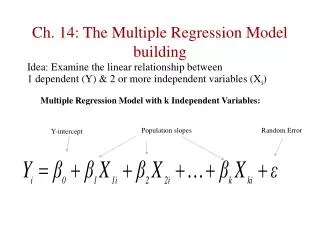
GENERAL FORM OF A MULTIPLE REGRESSION MODEL Since we can make substitutions similar to those just described, the general multiple regression model can be expressed as: y = 0 + 1 x1 + 2 x2 + 3 x3 + …. + k xk +
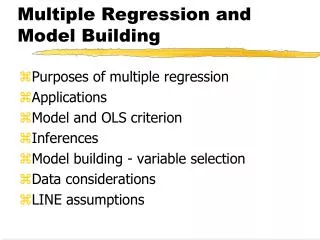
THE REGRESSION APPROACH • Hypothesize a form of the model • Determine the best estimates for the ’s • Assumptions about • Testing the strength of the model • Using the model for prediction/estimation
Example • It is felt that the price of a house in Laguna Hills is a function of its square footage, its lot size, and its age. • A sample of 38 recent sales in Laguna Hills is taken.
STEP 1: Hypothesizing a form of the model • One variable -- scatterplot • If it looks curved, hypothesize a higher order model and make transformations to a linear model • More than one variable • Simply HYPOTHESIZE – make a best judgment as the form of the model • Make appropriate substitution of variables so that the model is linear
Laguna Hills Model • There are three variables. • Hypothesize: y = 0 + 1x1 + 2x2 + 3x3 +
STEP 2: Determining the Best Estimates for the ’s • Involves complicated matrix operations but still uses the method of least squares. • Use computer (EXCEL) only • But the best values for the ’s minimizes the sum of the squared errors between the actual values of y and the predicted values for y -- i.e. They minimize SSE.
Note B1:D39 Must be a contiguous range Using Excel to Get the b’s Go to TOOLS/DATA ANALYSIS/REGRESSION
The regression equation: ŷ = 145326 +240.34591x1 +935401.9x2 – 12287.5x3
Since there is more than one x, we say x’s -- not just x That’s the only difference STEP 3: Assumptions For For any given set of the x’s: • has a normal distribution • E() = 0 Also: • Errors are independent • does vary between different values of the x’s
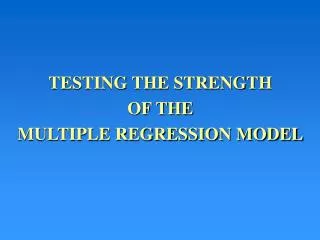
STEP 4:Assessing the Strength of the Model • Question 1: Can we conclude that at least one of the independent variables (x’s) is useful in predicting y? • Question 2: If yes, which of the independent variables (x’s) are useful in predicting y? • Question 3:What proportion of the overall variation in y is due to the changes in the x’s? These are addressed in another module.
Prediction/Confidence Intervals • These are possible • but not easily with EXCEL • Other Stat packages -- MINITAB, SPSS, SAS perform these calculations.
Important Excel Note -- Inputting a Contiguous Range for the X’s • Suppose in this example we wished to regress Price on only Sq. Feet (column B) and Age (column D). • These are not next to each other • They must be next to each other for the regression module in Excel to work • Highlight the data in column D and click “CUT” • Click cell C1, which is where you want the data to begin, with right mouse key • Click INSERT CUT CELLS
Highlight cells D1:D39. • With right mouse key click Cut 3. Place cursor on cell C1. 4. With right mouse key click Insert Cut Cells.
Column D (Age) has been moved before column C (Land)
Review • Multiple regression is used when – • y is a function of more than one x • y includes terms of x raised to a power • This can be converted to a linear term • Excel (or another stat package) is used to calculate the best estimates of the ’s • The assumptions about the error term are the same • is constant for all values of all the x’s