
Maximizing Irrigation Efficiency for Sustainable Farming
E N D
Presentation Transcript
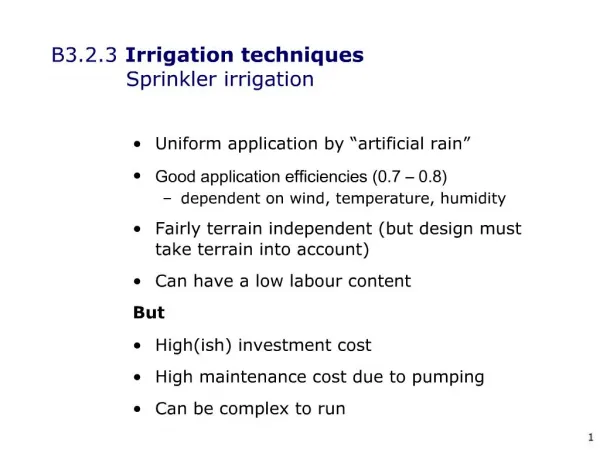
Irrigation Efficiency or IE • Water applied is never 100% beneficially used. • There is always some loss • Evaporation from soil and leaf surface • Evaporation losses can range from 1% to as much as 30% • Spray loss from water stream • Losses range from 1% to 4% • Surface run off • Deep percolation (water pushed past the root zone) * IE is a measure of the irrigator and the system
Distribution Uniformity or DU • Distribution Uniformity is the measure of how uniformly the water is applied * DUis a measure of the irrigation system Example of a good DU Example of a poor DU
The problem with a poor DU • If enough water is applied to ensure every plant is given adequate water, we overwater other plants. Example of a good DU Example of a poor DU
Potential DU • Permanent under tree sprinklers 95% • Linear Move 93% • Sloping Furrow 90% • Orchard Drip 90% • Border Strip of Flood 85% • Level Furrow 85% • Row Crop Drip 80% • Hand Move Sprinkler 75% This is potential. Actual DU are usually lower due to poor system design, suitability, system wear, and management.
Measuring Our Current DU • Sprinklers • Check pressures in various locations • Record pressures to compare with catch can numbers • Catch can evaluation • Place catch cans (minimum of 24) in an equal grid spacing • Run sprinklers to gain a representative sample • Measure and record amount of water collected in each catch can • Multiple tests give more accurate results • Near where the main line branches into laterals • In the middle of the field • At the ends of the laterals
Place all of the numbers in order from highest to lowest 122 ml 119 ml 118 ml 118 ml 115 ml 110 ml 108 ml 105 ml 105 ml 104 ml 100 ml 99 ml 99 ml 97 ml 96 ml 96 ml 96 ml 92 ml 91 ml 90 ml 90 ml 88 ml 88 ml 87 ml Lowest ¼ of the values
Measuring Our Current DU (EU) • Drip or Micro Sprinklers • Emitter Uniformity • Since we are not covering the entire ground surface, we only measure the water that is emitted during a certain time. • Measure the water from the emitter during a given time • Record amount of water collected from each emitter • Calculate emitter uniformity using the same method as used with the sprinkler catch can collection
Measuring Our Current DU • Drip or Micro Sprinklers • Emitter Uniformity
Measuring Our Current DU • Furrow or Flood Irrigation • Distribution Uniformity • Surface irrigation is difficult to calculate uniformity • The goal is to make opportunity time consistent across the field • Opportunity time = time the water is on the soil
Advance Recession Curve Recession Curve Time Opportunity Time Advance Curve Distance
Advance Recession Curve Slow advance times Recession Curve Opportunity Time Time Advance Curve Distance
Now, Make Improvements • Sprinklers, Drip and Micro Irrigation • Check the field at every startup • Look for damage and plugging • Repair leaking fittings and gaskets • Look for plant interference
Now Make Improvements • Sprinklers, Drip and Micro Irrigation • Nozzle differences • Wear • Over a period of time nozzles wear (replace them) • Miss management • Repair nozzles with correct replacements
Now, Make Improvements • Sprinklers, Drip and Micro Irrigation • Clean and maintain filters • Flush lines regularly • Keep application rates less than infiltration rates • Irrigate at night • Less heat & less wind (also saves on pumping costs) • If the field has pressure/flow problems, install pressure compensating sprinklers and emitters • Irrigate longer sets less often (minimize evaporation loss)
Now Make Improvements • Surface Irrigation (boarder strip and furrows) • Grade and level plots • Sloped furrows are more efficient than flat ones • Slopes range from .5% to 4% (depends on crop and soil type) • Develop a tail water system
Now Make Improvements • Surface Irrigation (boarder strip and furrows) • Faster advance times (get water to run faster) • Faster flow rates (fastest non erosive flow possible) • Shorter runs • Narrower runs • Manage wheel traffic and compaction • Use torpedoes
Make improvements and reevaluate • Efficiency in irrigation is a constant effort MJC Irrigation Technology https://www.mjc.edu/instruction/agens/irrigationtech