Fabric
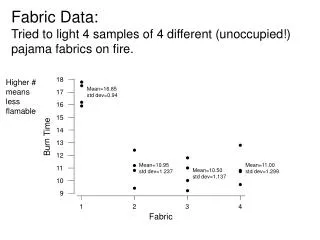
Fabric Data: Tried to light 4 samples of 4 different (unoccupied!) pajama fabrics on fire. 18. Higher # means less flamable. Mean=16.85 std dev=0.94. 17. 16. 15. e. m. i. 14. T. n. 13. r. u. B. 12. Mean=10.95 std dev=1.237. Mean=11.00 std dev=1.299. 11.


Fabric
E N D
Presentation Transcript
Fabric Data:Tried to light 4 samples of 4 different (unoccupied!) pajama fabrics on fire. 18 Higher #meanslessflamable Mean=16.85std dev=0.94 17 16 15 e m i 14 T n 13 r u B 12 Mean=10.95std dev=1.237 Mean=11.00std dev=1.299 11 Mean=10.50std dev=1.137 10 9 1 2 3 4 Fabric
Back to burn time example x s t0.025,3 95% CI Fabric 1 16.85 0.940 3.182 (15.35,18.35) Fabric 2 10.95 1.237 3.182 (8.98, 12.91) Fabric 3 10.50 1.137 3.182 (8.69, 12.31) Fabric 4 11.00 1.299 3.182 (8.93, 13.07)
Comparison of 2 means: • Example: • Is mean burn time of fabric 2 different from mean burn time of fabric 3? • Why can’t we answer this w/ the hypothesis test: H0: mean of fabric 2 = 10.5HA: mean of fabric 2 doesn’t = 10.5 • What’s the appropriate hypothesis test? x for fabric 3
H0: mean fab 2 – mean fab 3 = 0 HA : mean fab 2 – mean fab 3 not = 0 • Let’s do this w/ a confidence interval. • Large sample CI: (x2 – x3) +/- za/2sqrt[s22/n2 + s23/n3]
CI is based on small sample distribution of difference between means. • That distribution is different depending on whether the variances of the two means are approximately equal equal or not • Small sample CI: • If var(fabric 2) is approximately = var(fabric 3), then just replace za/2 with ta/2,n2+n3-2This is called “pooling” the variances. • If not, then use software. (Software adjusts the degrees of freedom for an “appoximate” confidence interval.) Rule of thumb: OK if 1/3<(S23/S22)<3 Read section 10.4 More conservative
Minitab example: Stat: Basic statistics: 2 sample t Two-sample T for f2 vs f3 N Mean StDev SE Mean f2 4 10.95 1.24 0.62 f3 4 10.50 1.14 0.57 Difference = mu f2 - mu f3 Estimate for difference: 0.450 95% CI for difference: (-1.606, 2.506) T-Test of difference = 0 (vs not =): T-Value = 0.54 P-Value = 0.611 DF = 6 Both use Pooled StDev = 1.19
Hypothesis test: comparison of 2 means • As in the 1 mean case, replace za/2 with the appropriate “t based” cutoff value. • When s21 approximately = s22 then test statistic is t=|(x1–x2)+/-sqrt(s21/n1+s22/n2)| Reject if t > ta/2,n1+n2-2 Pvalue = 2*Pr(T > t) where T~tn1+n2-2 For unequal variances, software adjusts df on cutoff.
“Paired T-test” • In previous comparison of two means, the data from sample 1 and sample 2 were unrelated. (Fabric 2 and Fabric 3 observations are independent.) • Consider following: • Investigator wants to see if exercise immediately affects the level of a specific chemical in the blood. She’ll do this by measuring and comparing the chemical in two groups: a control group that has not exercised and a treatment group that has. • Design 1: Two separate groups of 15 people each. • Design 2: People are their own controls. Measure before and after exercise. Design 1 is like what we’ve just done. Consider design 2 next.
Data from design two: One Way of Looking At it noex exercise [1,] 117 118 [2,] 153 156 [3,] 73 71 [4,] 64 65 [5,] 95 109 [6,] 120 123 [7,] 94 88 [8,] 106 121 [9,] 90 95 [10,] 96 110 [11,] 67 66 [12,] 102 112 [13,] 111 110 [14,] 127 133 [15,] 180 180 = exercise = noexercise 180 160 exercise mean = 110.47 140 Measure 120 100 No exercise mean = 106.33 80 60 2 4 6 8 10 12 14 person
noex - ex noex exercise diff [1,] 117 118 -1 [2,] 153 156 -3 [3,] 73 71 2 [4,] 64 65 -1 [5,] 95 109 -14 [6,] 120 123 -3 [7,] 94 88 6 [8,] 106 121 -15 [9,] 90 95 -5 [10,] 96 110 -14 [11,] 67 66 1 [12,] 102 112 -10 [13,] 111 110 1 [14,] 127 133 -6 [15,] 180 180 0 5 0 Measure -5 Mean difference = -4.14(noex – exercise) -10 -15 2 4 6 8 10 12 14 Index Of course, Mean difference = mean( noexercise ) - mean( exercise ) If we want to test “difference = 0”, we need variance of differences too. Note how “difference” takes person to person variability out of the graph. This is a good thing: less variability = more power
Paired t-test • One person’s first observation is dependent on the person’s second observation, but the differences are independent across twins. • As a result, we can do an ordinary one sample t-test on the differences. This is called a “paired t-test”. • When data naturally come in pairs and the pairs are related, a “paired t-test” is appropriate.
“Paired T-test” • Minitab: basic statistics: paired t-test: Paired T for Noex - Exercise N Mean StDev SE Mean Noex 15 106.33 31.03 8.01 Exercise 15 110.47 31.73 8.19 Difference 15 -4.13 6.46 1.67 95% CI for mean difference: (-7.71, -0.56) T-Test of mean difference = 0 (vs not = 0): T-Value = -2.48 P-Value = 0.027 • Compare this to a 2-sample t-test
Two-sample T for Noex vs Exercise N Mean StDev SE Mean Noex 15 106.3 31.0 8.0 Exercise 15 110.5 31.7 8.2 Difference = mu Noex - mu Exercise Estimate for difference: -4.1 95% CI for difference: (-27.6, 19.3) T-Test of difference = 0 (vs not =): T-Value = -0.36 P-Value = 0.721 DF = 28 Both use Pooled StDev = 31.4 • Estimate of difference is the same, but the variance estimate is very different: • Paired: std dev(difference) = 1.67 • 2 sample: sqrt[ (31.0^2 /15) + (31.7^2/15) ] = 11.46 • “Cutoff” is different too: • t0.025,13 for paired • t0.025,28 for 2 sample Paired is often better because it often has more power.