Download
1 / 13
140 likes | 278 Vues
This study explores the correlation between radio and gamma-ray emissions in blazars, focusing on a large sample of gamma-ray candidates monitored at high cadence. We investigate time lags between emissions, utilizing extensive light curves from Fermi and OVRO data. The statistical significance of these correlations is evaluated through simulated data, advancing our understanding of blazar variability. Our findings indicate that radio emissions often precede gamma-ray emissions. Future work will expand our dataset for deeper insights into this relationship.

E N D
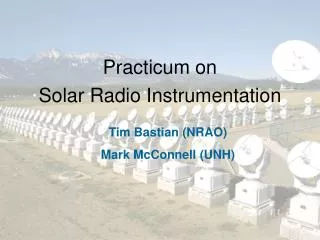
Radio/Gamma-ray time lags:Large samples and statistics Walter Max-Moerbeck On behalf of the OVRO 40m blazar monitoring team AGN Monitoring Workshop MPIfR, Bonn, Germany March 14, 2011
Correlated radio/gamma-ray variability • The hypothesis of correlated variability in radio and gamma-ray is popular • It would indicate a common spatial origin for radio and gamma-ray emission • But it needs to be proven!
Correlated radio/gamma-ray variability • Our approach: • Large sample of objects • Preselected as gamma-ray candidates • Observed independently of gamma-ray state • High cadence, observed twice per week • Statistical tests for correlations
A first look at the radio/gamma-ray cross-correlation • Data • Radio data published in Richards et al 2011 (ApJ submitted) • 2 year light curves for CGRaBS sources + a few calibrators • Gamma-ray data published in blazar variability paper, Abdo et al. 2010 ApJ, 722, 520 • 106 sources • 11-month light curves, weekly sampling • 52/106 are in the CGRaBS sample
Radio/gamma-ray time lags and their significance β_radio = 2.5, β_gamma = 2.0 • Significance evaluated using simulated data with a power-law PSD ~ 1/f^β Radio lags Radio precedes • Example cross-correlations. 3-month Fermi detections, using 11-months of Fermi data and 2 years of radio monitoring
Radio/gamma-ray time lags and their significance β_radio = 2.5, β_gamma = 2.0 • Significance evaluated using simulated data with a power-law PSD ~ 1/f^β Radio lags Radio precedes • Example cross-correlations. 3-month Fermi detections, using 11-months of Fermi data and 2 years of radio monitoring
Statistical test for the cross-correlation:Measuring the PSD • The significance level depends on the model used for the light curves • It is commonly assumed that it is red-noise with a simple power-law PSD • Uneven sampling complicates the model fitting • We use the method of Uttley et al 2002 MNRAS 332, 231 • With some modifications • Basic idea is to simulate data with a given PSD and process it as the data. The mean PSDs and deviations are used for model fitting
Significance versus PSD power-law exponent βradio= 2.5,βgamma-ray= 2.0 βradio= 2.0, βgamma-ray= 1.5 βradio= 0.0, βgamma-ray=0.0
Significance for longer time series 1 year of gamma-ray and 2 years of radio – dotted lines 5 years of gamma-ray and 6 years of radio – solid lines
Statistical test for the cross-correlation:Measuring the PSD Example light curves Goodness of fit –radio data J0017-0512 A large fraction have well constrained PSDs slopes n>/N β J0238+1636 Some PSDs are hard to constrain, we need longer time series n>/N β
PSD measurements first results Gamma-ray detected Gamma-ray non detected • The distribution of PSD power-law indices is different for gamma-ray detected/non-detected sources • This is consistent with gamma-ray quiet objects looking like white noise, without flares • A peak near beta~2.0 can be used when measuring significance
Cross-correlation the next step • Include all sources on1LAC (Fermi first year catalog) with 2 years of data in gamma-ray and at least 2 years in radio, more for CGRaBS • Main problem is to extract all the gamma-ray light curves and deal with upper limits, sparse or adaptive sampling • ~400 sources in our program • 221 CGRaBS
Summary • Paper in preparation using published Fermi and OVRO data • PSD is characterized for all radio sources • Cross-correlation significance will incorporate this new constraints on the variability behavior of blazars • Will submit before Fermi Symposium • Next step is to extend this to a larger set of gamma-ray sources and longer light curves at both bands