Download
1 / 31
310 likes | 464 Vues
Sharp or Smooth? Comparing the Effects of Quantization vs. Frame Rate for Streamed Video. J. McCarthy, M. A. Sasse and D. Miras. ACM Conference on Human Factors in Computing Systems Vienna, Austria, April 2004. Introduction (1 of 2).

E N D
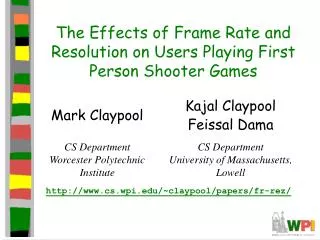
Sharp or Smooth? Comparing the Effects of Quantization vs. Frame Rate for Streamed Video • J. McCarthy, M. A. Sasse and D. Miras • ACM Conference on Human Factors in Computing Systems • Vienna, Austria, April 2004
Introduction (1 of 2) • Streaming sports (football) are popular Internet service • The NFL! … but they mean soccer • Key business for mobile services • Little known about quality levels required • Minimum for acceptable quality? • For given constraint, what is best? • Note, constraint may be bitrate capacity or power or … • Recent IBM QoS policy says: • “The priority for smooth video is higher than the priority for frame quality” • Yet, available evidence suggests sports are relatively insensitive to changes in frame rate
Introduction (2 of 2) • Discover functions relating physical quality to perceived quality • Graphs give service providers knowledge to manage resources • New methodology • Test sports on sports enthusiasts (may buy) • Gradually increase or decrease video perf within clip to determine acceptability edge • Investigate effects of frame rate and quality (quantization) on acceptability • Get subjective responses and eye movements • Examine palmtop and desktop
Outline • Introduction (done) • Background • Method • Study 1 (Desktop) • Results • Study 2 (Palmtop) • Results • Conclusions
Background – Perceived QoS • Typically, show short (~10 second) clip and measure with 5-point rating [11] • Problematic when network conditions vary over time • Problematic when content changes over time • Continuous quality evaluation using a slider [3,4,8,14] • But can be intrusive for real-time tasks
Background – Physical QoS • Physical metrics impacting quality: resolution, frame rate, frame quality (quantization) [6] • For MPEG type compression, quantization of the DCT coefficient dominates • Other metrics that impact quality: size of display, distance between observer and display • For the service provider, primary factors they can control are frame rateand frame quality • Focus on those in this study
Background – Service Providers and Acceptability • Service providers need metric to relate physical quality to perceived quality • Neither MOSnor slidergive good indication of acceptability (Ex: is MOS of 3 acceptable?) • Some researchers have used a 5-point acceptability scale [5,9] • Draw upon this work for new metric: • Easy to understand • Less disruptive than continuous techniques • Can be used with variable video quality • Is more relevant to service providers
Background – Relevant Studies • Most related work shows sports insensitive to frame rate changes • Apteker et al. [2] study frame rates 5, 10, 15 fps and show acceptability of sports highlihghts little difference • Ghinea and Thomas [7] show information content same for 5, 15, 25 fps • Wang et al. [15] manipulate frame rate and quantization for 8 second video (American football) • “Quantization distortion is generally more objectionable than motion judder” • All run against intuition that higher motion needs higher frame rate
Outline • Introduction (done) • Background (done) • Method • Study 1 (Desktop) • Results • Study 2 (Palmtop) • Results • Conclusions
Method • Method of Limits (Fechner in [5]): • Gradually increase stimulus in steps until it is just detectible • Give subject binary (yes/no) to detect • Also run in reverse (decrease) • Authors: Variant of this: ask users if acceptable or not • Use 210 second clips, increase/decrease quality every 30 seconds (7 types) • But don’t tell users, only “varied in quality”
Quality Gradients • Three types • Temporal: Frame rate (fps) • Quality: Quantization • Both • Each has 7 levels • (30 seconds x 7 = 210 s) • User free to say “acceptable” or “unacceptable” as much as want
Eye Tracking • Measure where users looked using remote eye-tracking camera • Measure with EyeGaze from LC technologies [13] • Record where looking with EyeSpy (open source) • Help identify regions of inerest could, someday, make compression use info • More detail for area user looking at (ex: ball and person kicking) • Less detail for background (ex: pitch, fans)
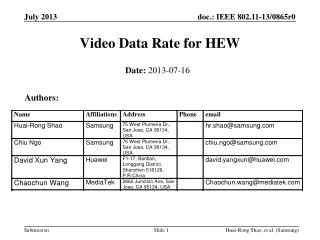
Source Material • Sourced from DVD of recent match between Manchester United and Arsenal • Three clips, include variety of camera angles and shots (including replays) • CIF (252x288) for study 1, QCIF (176x144) for study 2 • H.263 encoded for quality gradients • Re-encode to MPEG so could use commercial (ie- RealPlayer) • Audio for all clips is 64 kbps • Total of 18 clips for study 1, 9 clips for 2
Outline • Introduction (done) • Background (done) • Method (done) • Study 1 (Desktop) • Results • Study 2 (Palmtop) • Results • Conclusions
Study 1 – Small Screen on Desktop • 41 participants (29 male, 12 female) • Average age 22 • Paid 5 pounds (about $8) • Tried to recruit those who liked soccer and watched regularly • 59% one+ per week, 88% rooted for a team, 50% supported one team in clip • 352x288 resolution on LCD with 1024x768 • RealPlayer set to theater mode (rest is black)
Study 1 – (Continued Design) • Each saw 6 clips: FPS, Quant, FPS+Quant • both increasing and decreasing gradients • Counter-balance with “Greco Latin” squares design (no sequences appear more than once row or column) • Participants briefed first • Told Telecom company wanted acceptable region
Outline • Introduction (done) • Background (done) • Method (done) • Study 1 (Desktop) (done) • Results • Study 2 (Palmtop) • Results • Conclusions
Perceived Quality and Frame Rate Transform binary to ratio by calculating which portion of 30 seconds acceptable (Ex: unacceptable at 20s of the 30 would be 0.667) 95% conf intervals ANOVA test says all different At 6 FPS, quality is acceptable 80% of the time
Perceived Quality and Quantization 95% conf intervals - Again, ANOVA test says difference - Sharp drop after 8 - Interesting shape
Quantization and Frame Rate - ANOVA test says difference - Similar to quantization alone - Suggest quantization dominates
Eye Movements Averaged over all clips Units? Maybe sample every 250ms? Similar across all clips – focus is on center. May be because nature of video – action is in center. Could use this region of interest in compression - use more bits on area where gaze is focused
Outline • Introduction (done) • Background (done) • Method (done) • Study 1 (Desktop) (done) • Results (done) • Study 2 (Palmtop) • Results • Conclusions
Study 2 – Study on a Palmtop • 37 participants (31 male, 6 female) • Mean age 22 • Paid 5 pounds (about $8) • Tried to recruit those who liked soccer and watched regularly • 65% one+ per week, 84% rooted for a team with 38% supporting one team in clip • (Me: not clear if participant overlap between studies) • 176x144 resolution, iPAQ h2210 • Additional clip to study critical values
Perceived Quality and Frame Rate - Less acceptable on palmtop than desktop - Driven by one clip (B) with panning and action - Still acceptable at least 50% of time at 6 FPS
Perceived Quality and Quantization - Similar for both - Again, critical value at 8
Quantization and Frame Rate - Again, palmtop appears slightly more sensitive - May be because of frame rate
Critical Values, Acceptability and Bandwidth - Study relationship with 4th clip - Examine only critical values from previous study - For low quality, drop in frame rate may compound? - Me: quantization dominates for bandwidth (was not comparing “apples to apples” before)
Qualitative Comments • When “unacceptable”, users give reasons: • 84% said recognizing players was impossible • 65% had problems following the ball • 35% said close up shots fine, but distant camera shots very poor • 21% cited jerky movement as one problem • Summary statement: • “I’d rather have jerky video and better quality pictures”
Conclusions • Limitations of approach • Additional degradations are not factored in (packet errors, changing capacity, etc.) • Substantive findings • Response curve relating perceived quality to physical quality • Population of users with clear interest (i.e. would be consumers) • At 6 fps, 80% of the time, video is acceptable • Challenges assumption that sports must be high frame rate • Methods of limits • Provides stable metric • Curves in line with ITU logistic with quality
Future Work • Other video content • Include measure of motion • Investigate using eye tracking data for compression • Need computationally cheap way to save bandwidth without impacting quality • Same bitrate for quality versus frame rate (versus resolution)