Download
1 / 19
190 likes | 353 Vues
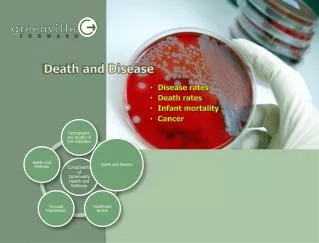
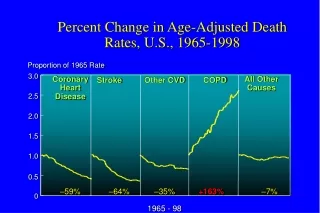
DEATH RATES. United States 100% Missouri 100% Northwest Missouri 100%. 2003 Leading Causes of Death in the US “Public Health Impactâ€. Total Number of Deaths = 2,443,908. 1990 & 2004 Leading Actual Causes of Death in the US—“Human Behaviorsâ€. Source : CDC.

E N D
DEATH RATES • United States 100% • Missouri 100% • Northwest Missouri 100%
2003 Leading Causes of Death in the US “Public Health Impact” Total Number of Deaths = 2,443,908
1990 & 2004 Leading Actual Causes of Death in the US—“Human Behaviors” Source: CDC
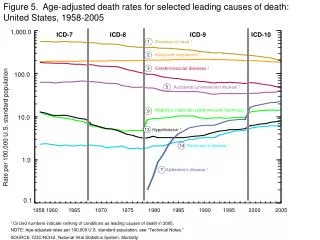
Causes of Death and Major Illnesses in the U.S. Source: CDCP, PHS, DHHS
Risky BusinessLarge numbers of Americans cling to lifestyles that greatly increase their risk of cancer, heart disease, and diabetes. Over the past decade, the percentage of those who smoke has remained stubbornly unchanged, while more than one out of four has remained a couch potato and nearly twice as many have become obese. U.S. Missouri St. Joseph 45.0% 40.0% 35.0% 30.0% 25.0% 20.0% 15.0% 10.0% 5.0% 0.0% 1997 2001 2007 1997 2001 2007 1997 2001 2007 Current Smokers No Leisure Time Physical Activity Obese Source: National Center for Chronic Disease Prevention and Health Promotion Behavioral Risk Factor Surveillance System 2007
1991 Obesity Trends* Among U.S. Adults BRFSS, 1991, 1996, 2004 (*BMI ³ 30, or about 30 lbs overweight for 5’4” person) 1996 2004 No Data <10% 10% – 14% 15% – 19% 20% – 24% >25% Source: Behavioral Risk Factor Surveillance System, CDC.
1990 1995 2001 No Data <4% 4% - 6% 6% - 8% 8% - 10% >10% Diabetes Trends* Among Adults in the U.S., (Includes Gestational Diabetes) BRFSS, 1990,1995 and 2001 Source: Mokdad et al., Diabetes Care 2000;23:1278 - 83; J Am Med Assoc 2001;286:10 .
Baseline 20th Century Annual Morbidity and 1999Provisional Morbidity from Nine Diseases with Vaccines Recommended Before 1990 for Universal Use in Children – United States
% Overweight Boys 1963 = 4.0% 1994 = 11.8% 2000 = 16% % Overweight Girls 1963 = 4.5% 1994 = 11.0% 2000 = 14.5% Early childhood education. Low birth weight/very low birth weight. High school completion. Teen birth rates. Motor vehicle crashes (with and without alcohol/drug factors). Asthma >40 per 1000 children in 1982 >62 per 1000 children in 1996 Current & Future Health Challenges Infant and Child Health • Healthy weight. • % overweight in 1971 = 4% • % overweight in 1994 = 10.5% • % overweight in 2000 = 15.3% • Smoking. • Violence. • Suicide. • Sexually transmitted disease.
The Dilemma • So why are we afraid for our kids health? • Modern children’s health issues are preventable, yet scary because of the illusion that science can fix everything like it did in the last century. • Health happens at the intersection where science meets social, spiritual, educational, economic, family, behavioral and community circumstances. • We can’t give a shot to become a better parent, or immunize a 14 year old to make wise choices.Science has limits!
The USA Ranks 37th in World Health. World Health Report 2000 (health system and performance in all member states, ranked by eight measures) places the USA 37th in overall system performance.
Missouri Ranks 38th in USA Health. There are several indicators to compare on health status. For the 2004 CDC BRFSS question: “How would you rate your health in general?” 84.1% of Missourians said excellent, very good, or good to the question. Missouri ranks 38th in the nation. The top states are Minnesota and New Hampshire.
People Policy 2004 USA Deaths 2,397,615 Provider Response & Individual Accountability Healthcare Policy Heart, Cancer, Stroke, Pulmonary, Diabetes… Public Health & Organizational Policy 2000 Actual Causes of Death “Human Behaviors” Individual Accountability Tobacco, Obesity, Diet, Inactivity, Alcohol, Motor Vehicle… Community, Economic, Education, & Social Policy Individual & Community Accountability Root Causes “Human Conditions” Stress, Anger, Poverty, Economics, Education Levels, Depression, Unemployment, Broken Families, Environmental Factors, Emptiness, Hopelessness, Disconnectedness Adapted From: National Civic League, Healthy Communities Conference 1994 Updated With CDC Data & Best Practices
HEALTHY COMMUNITIES The two key determinates of the health status of a population: • Education Levels • Affluence (Jobs)
“If I had known I would live this long, I would have taken better care of myself.” Mickey Mantle
With No Changes, Projected Cost Growth in Health Care Is Large 4.5 4.0 10 Years 3.5 2.1 Trillion(100%) 3.0 Annual healthexpenditures(trillions) 2.5 2.0 Official CMS projection of healthcare cost growth 1.5 1.0 .5 0 2002 2004 2006 2008 2010 2012 2014 2016 Year
HEALTHY COMMUNITIESIDEAL APPROACH • Individuals assume responsibility (maximum extent possible) for their own and their families’ health • Healthy behaviors • Personal financial responsibility for health • Health insurance designed to promote and encourage healthy life styles and wise buying practices • Encourage preventive care • Design benefits to influence positive behavior • Reward healthy behaviors • Universal coverage and portability
HEALTHY COMMUNITIESIDEAL APPROACH • Higher premiums for non-managed care – lower premiums for managed care. • Comprehensive integrated health provider (like Heartland) that exist to serve the community interest