Download

1 / 16
160 likes | 274 Vues
This study evaluates the effects of allele frequency estimates on genomic predictions and inbreeding coefficients in Holstein bulls, utilizing data from 5,335 individuals and 38,416 SNPs from the Illumina Bovine SNP50™ Chip. We compare genomic relationships to traditional methods and demonstrate how different allele frequency estimation approaches influence predictions. The findings indicate that more accurate frequency estimations yield better genomic relationships and inbreeding calculations, affirming the importance of methodology in genomic evaluations.

E N D
Effects of Allele Frequency Estimation on Genomic Predictions and Inbreeding Coefficients
Experimental Design • Predict April 2008 PTA from August 2003 PTA • 3,576 older Holstein bulls • 1,759 younger bulls (total = 5,335) • Using 38,416 SNP from Illumina Bovine SNP50TM Chip
Goals • Compare genomic to traditional relationships and inbreeding • Formulas to compute G and A • G – A differences for 5,335 bulls • Compare genomic predictions using different estimates of frequency • Estimate 38,416 allele frequencies • Simple estimates vs. base population • Or ignore frequency, use 0.5 instead
Differences in G and A • Detected clones, identical twins, and duplicate samples • Detected incorrect DNA samples • Detected incorrect pedigrees • Identified correct source of DNA by genomic relationships with other animals
Genotype Data for ElevationChromosome 1 1000111220020012111011112111101111001121100020122002220111 1202101200211122110021112001111001011011010220011002201101 1200201101020222121122102010011100011220221222112021120120 2010020220200002110001120201122111211102201111000021220200 0221012020002211220111012100111211102112110020102100022000 2201000201100002202211022112101121110122220012112122200200 0200202020122211002222222002212111121002111120011011101120 0202220001112011010211121211102022100211201211001111102111 2110211122000101101110202200221110102011121111011202102102 1211011022122001211011211012022011002220021002110001110021 1021101110002220020221212110002220102002222121221121112002 0110202001222222112212021211210110012110110200220002001002 0001111011001211021212111201010121202210101011111021102112 2111111212111210110120011111021111011111220121012121101022 202021211222120222002121210121210201100111222121101
Genotype Data from Inbred BullChromosome 24 of Megastar 1021222101021021011102110112112211211002202000222020002020220 0000220020222202202000020020222222000020222200000220200002002 2002000000222200022220000000000020222022002000222020222220002 2022222222200002002202022202000200022000000002202220000002200 2020002222002020020020202220222222220222020002022022022220202 2202020202200022002220220022200000220200002002002000200222220 0022220202002220022202000020200000022222020200002002002222000 2022022220022000222202200222202020002202202222002220022000200 2202000002200220222000022000022000222202002222000220020020202 2020002220002220022202202200000220220020020020220002000222202 2002220020220200222202220000020220002020020202000220022000002 2022200202220200022002000200022002002000200220222220022022000 2000020002000020220020220200200002220000222002000200222000022 0220020022002202202020202020200022202000220200202202220220000 2020200002020200022222200222200020022022220000020220020200202 022022020200002000200220220002200
Close Inbreeding (F=14.7%): Double Grandson of Aerostar Aerostar Megastar Aerostar Chromosome 24
3 Formulas to Compute G • Sum products of genotypes (g) adjusted for allele frequency (p) • G1jk = ∑ (gij-pi) (gik-pi) / [2 ∑ pi(1-pi)] • Or individually weighted by p • G2jk = ∑ (gij-pi) (gik-pi) / 2pi(1-pi) • Or scaled by intercept (b0) and regression (b1) on A, using p = 0.5 • G3jk = [∑ (gij - 0.5) (gik - 0.5) – b0] / b1
Compare A with 3 formulas for GSimulated Data 1Diagonal = 1 + Inbreeding
Compare A with 3 formulas for GActual Data 1Diagonal = 1 + Inbreeding
Summary of G Formulasfor Genomic Inbreeding • Correlations ranked G3 > G1 > G2 in simulation vs. G2 > G1 > G3 with real data (opposite) • G2 and G1 biased down, G3 up • G1 and G2 can be adjusted toward A using b0 and b1, similar to G3 formula • After adjusting, mean G1 = 1.08 and G2 = 1.09 compared to G3 = 1.13 and A = 1.05 • G1 was unbiased in simulation using true rather than estimated frequencies
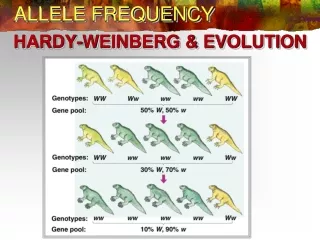
Allele Frequency Estimation • Base population frequencies • Combine genotypes and pedigrees • Efficient algorithm (Gengler, 2007) • Simple frequency estimates • pi = ∑ gij / 2n • Extra simple estimates (p = 0.5) • Z = 0.5, 0, -0.5 in mixed model
Conclusions • Genomic relationships and inbreeding are more useful than Wright’s 1922 pedigree formulas • Formulas to compute G have • Large effects on inbreeding coefficients • Small effects on reliability of predictions • Estimates of allele frequencies • For base population better than simple • Not needed using regression of G on A
Acknowledgments • Funding: • National Research Initiative grants • CDDR Contributors (NAAB, Semex) • Genotyping and DNA extraction: • BFGL, U. Missouri, U. Alberta, GeneSeek, GIFV, and Illumina • Computing from AIPL staff • George Wiggans, Leigh Walton