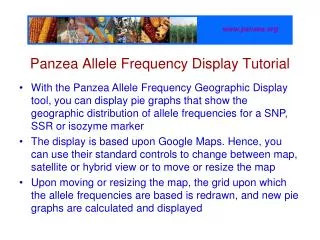
Panzea Allele Frequency Display Tutorial
www.panzea.org. Panzea Allele Frequency Display Tutorial. With the Panzea Allele Frequency Geographic Display tool, you can display pie graphs that show the geographic distribution of allele frequencies for a SNP, SSR or isozyme marker

Panzea Allele Frequency Display Tutorial
E N D
Presentation Transcript
www.panzea.org Panzea Allele Frequency Display Tutorial • With the Panzea Allele Frequency Geographic Display tool, you can display pie graphs that show the geographic distribution of allele frequencies for a SNP, SSR or isozyme marker • The display is based upon Google Maps. Hence, you can use their standard controls to change between map, satellite or hybrid view or to move or resize the map • Upon moving or resizing the map, the grid upon which the allele frequencies are based is redrawn, and new pie graphs are calculated and displayed
www.panzea.org Panzea Allele Frequency Display Tutorial Choose the marker of interest and display initial map Change to “hybrid” (combined map & satellite) view Choose a single species or subspecies to display Change the zoom level Obtain underlying information for a pie graph Simplify pie graphs by pooling low frequency alleles Display pie graphs for a single allele Reposition the map Tasks demonstrated:
www.panzea.org 1) Choose marker of interest and display initial map
www.panzea.org 1) Choose marker of interest and display initial map We will use an SSR marker as an example, so here we will only change the Marker Type, and leave the other options in their default settings
www.panzea.org 1) Choose marker of interest and display initial map For example
www.panzea.org 2) Change to ‘hybrid’ (combined map & satellite) view
www.panzea.org 3) Choose a single species or subspecies to display Then click the “Filter” button (hidden under this drop down list in this view) spp. mays will display maize landraces only (since inbred lines do not have geographical coordinates)
www.panzea.org 4) Change the zoom level Click here to zoom out
www.panzea.org 5) Obtain underlying information for a pie graph Click on a pie chart for details
www.panzea.org 5) Obtain underlying information for a pie graph Details for that pie chart then appear here. Use the scroll bar at the right to see them all
www.panzea.org 6) Simplify pie graphs by pooling low freq. alleles
www.panzea.org 6) Simplify pie graphs by pooling low freq. alleles
www.panzea.org 7) Display pie graphs for a single allele Choose allele 92 (for example), and then click the “Filter” button (hidden under this drop down list in this view)
www.panzea.org 7) Display pie graphs for a single allele
www.panzea.org 8) Reposition the map Use these arrow buttons to move the map, or click on the map and drag (hand tool)
www.panzea.org 8) Reposition the map