Intragenic Recombination and Haplotype Diversity of Hd1 in Cultivated Rice
This study investigates intragenic recombination within the Hd1 gene among cultivated rice varieties, focusing on the genetic structure, allele groups, and haplotype patterns. Findings reveal the positions of recombination points and highlight the differences in haplotypes among diverse rice accessions. The research also includes a neighbor-joining tree illustrating relationships among Hd1 alleles and their wild relatives. The results contribute to understanding the functional evolution of Hd1 and its implications for rice breeding and genetics.

Intragenic Recombination and Haplotype Diversity of Hd1 in Cultivated Rice
E N D
Presentation Transcript
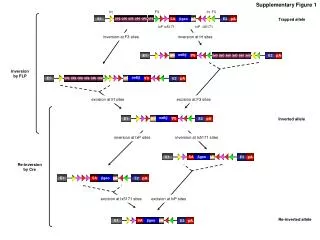
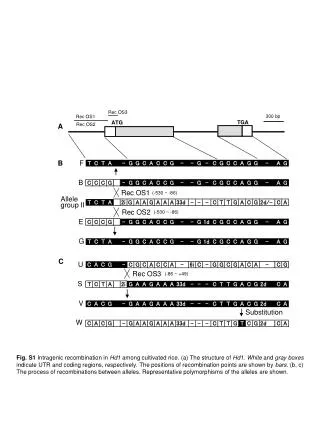
Rec OS3 Rec OS1 Rec OS2 A B F B Rec OS1 (-530 ~ -86) Allele group II Rec OS2 (-530 ~ -86) E G C U Rec OS3 (-86 ~ +49) S V Substitution W Fig. S1 Intragenic recombination in Hd1 among cultivated rice. (a) The structure of Hd1. White and gray boxes indicate UTR and coding regions, respectively. The positions of recombination points are shown by bars. (b, c) The process of recombinations between alleles. Representative polymorphisms of the alleles are shown.
Q 52 N O 57 M II L P 98 K R S 94 J V IV 98 W F 94 G Gin 59 71 I 56 74 81 H A I D 84 B 85 C 98 75 E W0106 (O. rufipogon) 0.001 U III 63 T 99 W0652 (O. barthii) W1169 (O. glumaepatura) W1413 (O. longistaminata) Fig. S2 Neighbor-joining (NJ) tree of 23 alleles of cultivated rice and 4 accessions of its wild relatives carrying AA genomes; O. rufipogon (W0106), O. glumaepatula (W1169), O. barthii (W0652), and O. longistaminata (W1413). Bootstrap analysis values from 1,000 replications are shown at the nodal branches. The indicated scale represents 0.001 substitutions per site. This analysis was conducted using MEGA version 3.1 software (Kumar 2004).
Fig. S3 Haplotype patterns of the chromosomal regions surrounding Hd1 in 60 cultivated rice varieties. Graphical representation of haplotype patterns of the chromosomal region. Letters indicate the haplotype of each region with the colors of haplotype blocks. In Hd1 alleles, red indicates loss-of-function alleles and boldboxes indicate the 2-bp deletion. Information of accessions is referred from Table S1.
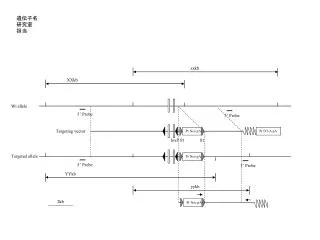
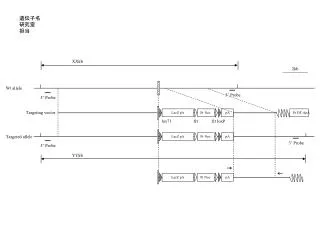
A Rec5 Rec4 Rec3 Rec7 Rec6 Rec2 Rec1 B 5 Rec1 (+1205 ~ +1570) 6 7 Rec2 10 (+1131 ~ +1205) 3 Rec3 13 (+1131 ~ +1181) 9 19 Rec4 (+1131 ~ +1524) 18 26 Rec5 (+1531 ~ +1566) 28 U1 Rec6 27 (+1630 ~ +1714) 37 8 (+1181 ~ +1205) Rec7 31 30 Fig. S4 Intragenic recombination in Hd1 among O. rufipogon. (a) The structure of Hd1. White and grayboxes indicate UTR and coding regions, respectively. The positions of recombination points are shown by bars. (b) The processes of recombination between alleles. Representative polymorphisms of the alleles are shown.
12 34 X X X X X X X 4 1 Allele group I 3 18 45 37 2 31 6 41 5 R2 8 R7 38 15 36 R1 10 14 19 4 21 35 7 30 7,24,32 R3 13 16 17 13 15 6,11 1 22 2 17 34 9 31 47 33 32 19 R4 26 5,23 Allele group III 3 18 33,36 11 29 R5 26,27 28,39 12 21 28 U1 42 R6 46 22 27 43 Allele group IV 20 30 25 29 37 16 24 23 Allele group II Fig. S5 Hypothetical process of the evolution of Hd1 among O. rufipogon and cultivated rice varieties. This model was constructed by step-by-step coalescence based on polymorphisms in the 725-bp region of Hd1, which are shown in supplemental Table S4. The number in the box indicates the haplotype. Numbers beside arrows indicate the mutation event in supplemental Table S4. Haplotype U1 was an unidentified haplotype in this population. Intragenic recombinations are shown as R1 to R7.
Q L L V V V W M M M M N O O O S H I B J C P F T R K B J C C U B P E R R C D G B B J A Fig. S6 Distribution of Hd1 alleles among cultivated rice. Letters in boxes indicate Hd1 alleles. Bars under the letters and red circles indicate alleles with FNPs and the 2-bp deletion, respectively. Boxes are colored according to the Hd1 allele groups.