Atomic data for spectral fitting and synthesis
540 likes | 736 Vues
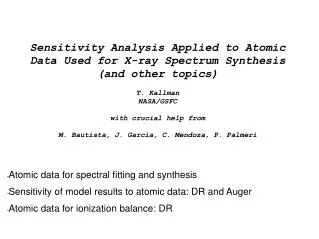
Sensitivity Analysis Applied to Atomic Data Used for X-ray Spectrum Synthesis (and other topics) T. Kallman NASA/GSFC with crucial help from M. Bautista, J. Garcia, C. Mendoza, P. Palmeri. Atomic data for spectral fitting and synthesis Sensitivity of model results to atomic data: DR and Auger

Atomic data for spectral fitting and synthesis
E N D
Presentation Transcript
Sensitivity Analysis Applied to Atomic Data Used for X-ray Spectrum Synthesis(and other topics)T. KallmanNASA/GSFCwith crucial help fromM. Bautista, J. Garcia, C. Mendoza, P. Palmeri • Atomic data for spectral fitting and synthesis • Sensitivity of model results to atomic data: DR and Auger • Atomic data for ionization balance: DR
900 ksec Chandra HETG spectrum of NGC 3783 (Krongold et al 2004;Kaspi et al. 2001, 2003;Netzer et al. 2004;Blustin et al 2002) • Chandra and XMM have provided spectra which have the best spectral resolution and sensitivity in the X-ray band obtained so far .. • With surprising consequences: • Discovery of outflowing X-ray gas • Relatively low velocity • Weak or absent emission • Possibly large mass loss rate
The challenge of X-ray astronomy Choose inputs (x, ..) “science” Calculate Ionization, T.. “model” “xspec” Synthesize spectum Instrument response Synthetic data no Agree? Observed data (pulse height)
Photoionization modeling • Traditional photoionization based on nebular approximation: clean separation of ionization balance from excitation • But this neglects effects likely to be important in X-ray plasmas: high density and radiative excitation. • We attempt to solve self-consistently for population kinetics, ionization, and radiative equilibrium. • Atomic processes • Photoionization (including inner shells, Auger decay • Recombination (RR, DR, …) • Collisional processes • Compton scattering • Charge transfer • Emission/absorption associated with these processes • A key challenge is the accumulation of complete, yet accurate atomic data. • Radiation transfer is still highly simplified • But we don’t really know how errors propogate..
Fit of photoionization model to Chandra HETG observation of NGC 3783 3 4 4 5 5 6 6 7 7 8 8 9 9 10 10 11 11 12 12 13 13 14 14 15 15 16 16 17 17 18 18 19 wavelength (A) 2 Component Fit, logx=2.2, 0.1 x=4p flux/density c2~18516/8192, voff=700 km/s vturb=300 km/s
Favored region x=4p flux/density
Fitting absorption only is fraught, due to influence of scattering/reemission
Al XII Al XIII
Effect of atomic data Current model (Chianti V.5) (cf. Berrington &Tully 1997 Chidichimo 2005 Landi and Gu 2006 Feldman 2000, Brown et al. 2002 Fawcett et al. 1987 Landi and Phillips 2005, Kucera 2000, Edlen 1984, Shirai et al. 2000, Butler and Zeippen 2001, Mclaughlin and Kirby 2001, Feldman et al. 1998, Young et al. 1998, Thomas and Neupert 1994, Brosius et al. 1998 Eissner et al. 1999, NIST, Berrington et al. 2005) (Using Chianti v.3)
what do we learn from Spectral fitting tests? • We can get ~acceptable fits to some of the highest s/n spectra in the X-ray band • Many line wavelengths fit adequately • Effects of rydberg series, Fe M shell UTAs • Ionization balance is ~OK • Recent improvement due to inclusion of data from Chianti v.5 and Fe L shell data from Landi and Gu (2006) and experimental and IP references (too numerous to mention here, but indispensable) • There are still many lines (eg. Al, inner shells of medium-Z elements) missing from the database (I use), and some wavelengths may need reexamination • Data needed for spectrum synthesis (wavelengths, ids, etc.) is (are?) crucial to deriving astrophysical results owing to detector limitations, blending, counting statistics.
How sensitive are the spectral fits to rates affecting ionization balance? • Procedure: • We perturb the DR rates coefficients by a constant factor in the log, and examine the effects on the ionization balance and on the results of spectral fits such as those shown in the previous section • We also examine the effects of 2x changes in Auger rates • Past work: • Gianetti Landi and Landini (2000) examine 3 different ionization balances on abundance determinations. Compare Shull and VanSteenburg, Arnaud and Rothenflug and Mazzotta effects on line ratios of high vs. low FIP lines. Compare with observed Soho CDS data. • Find that DEM is very different among the 3 curves, factors ~several. • Inferred abundances also differ by ~2x. • Savin and Laming (2002) discussed the effects of uncertainties in DR rates on inferred solar abundances. In this case the observed line emission may be from temperatures different from the temperature of peak abundance • They show that inferred solar abundances can differ by factors as much as 5 given their estimates of the DR rate coefficients
Dielectronic rate coefficients • Existing rates: Arnaud and Raymond; Culled from various theoretical works, mostly DW: • Fe 24+: Chen (1986a) • Fe 23+: Romanik (1988) • Fe 22+, Badnell (1986) • Fe 21+, Badnell (1986) • Fe 20+ Roszman (1987, 1990) • Fe 19+ Roszman (1987, 1990) • Fe 18+ Roszman (1987, 1990) • Fe 17+ Dasgupta and Whitney (1990) • Fe 16+ Smith et al (1995) • Fe 15+ Jacobs (1977) • Experiments suggest ~20% accuracy for the best calculations (eg. Savin et al. 2002…)
Iron Recombination rate coefficients vs. temperature Perturbed DR rates: log(Rate’) =g log(Rate) 0.9 <g<1.1 Baseline dielectronic recombination (DR) rate (including radiative cascades from n>5) based on Arnaud and Raymond (1992); cf. Also work by Nahar and Pradhan
Photoionization equilibrium x=4p Flux/density baseline Perturbed DR --> Dlog(x)=0.2 or greater
Photoionization equilibrium x=4p Flux/density baseline Auger enhanced 2x --> Dlog(x)=0.1
What’s the effect on the spectrum? Fe XXII baseline
What’s the effect on the spectrum? Fe XXI baseline
What’s the effect on the spectrum? Perturbed DR
What’s the effect on the spectrum? Perturbed DR
Photoionized Fitting results • For baseline model: • c2=11105/3400 • Log(x)=2.2,0.1 (similar to Krongold et al.) • Abundances:[Ne/O]=1, [Si/O]=1, [S/O]=2, [Fe/O]=0.4 • With perturbed DR, no iterations • c2=17660/3400 • With perturbed DR, iteratively fit • c2=13072/3400 (worse!) • Log(x)=2.9,0.1 (Significantly different!)
Sensitivity analysis Summary • photoionized: D log(DR rate coefficients) <0.1 • --> D log(xpeak) ~0.2 or greater • Detailed abundances of minority ions change by factors ~several • Results of fitting to Chandra spectrum detectable, D (DEM)~0.5 in log(x) • Smaller effects are associated with 100% changes in Auger This represents statistically significant effects on the spectrum, which affect quantititative results.
We can also test other calculations… • Recent work (Badnell and coworkers 2003-2006; Gu 2003, 2004) has resulted in dr rates which are likely to be more reliable, due to: • Experimental validation of resonance structure • Efficient computational algorithms • Allowing inclusion of many channels for dr and autoionization • Treatment of fine structure at high (>10) Z • Importance of forbidden autoionization rates • Allow for treatment of level-resolved DR (but we have not adopted these yet) • We consider the effects of introducing these into model calculations
Red=Arnaud and Raymond Black=Badnell et al.
Red=Arnaud and Raymond Black=Badnell et al.
Red=Arnaud and Raymond Black=Badnell et al.
0 Effect of changing dr rate coefficients on the ionization balance of iron Arnaud and Raymond -2 Log(ion fraction) 0 Badnell et al. -2 Log(x)
So what happens to spectral fitting? • From sensitivity experiment: • If DR rates change enough to move ion fractions by Dlog(x) >0.1 , then fitting results reflect this change • But the new DR rates have a smaller effect for many ions • Exceptions: Fe 15+ , Fe 16+ .. • Fitting results for NGC 3783 find similar c2, with the exception that the fit using the newer DR rates is slightly improved, Dc2~30. • Perhaps DR is not a major contributor to model uncertainty, for photoionized models
Arnaud and Raymond Badnell et al. l (A)
So what happens to spectral fitting? • From sensitivity experiment: • If DR rates change enough to move ion fractions by Dlog(x) >0.1 , then fitting results reflect this change • But the new DR rates have a smaller effect for many ions • Exceptions: Fe 15+ , Fe 16+ .. • Fitting results for NGC 3783 find similar c2, with the exception that the fit using the newer DR rates is slightly improved, Dc2~30. • Perhaps DR is not a major contributor to model uncertainty, for photoionized models
conclusions • Spectrum synthesis • Propogation of errors in rates affecting ionization balance • Importance of new DR rates
What atomic data goes into models? In this talk I will discuss the effects of changes in recombination and Auger on model results
Coronal ionization balance Perturbed DR baseline --> Dlog(T)=0.1
Fit to HETG Cappella Spectrum Fe 17+ Fe 16+ Fe 16+ Fe 17+ Fe 19+ Fe 18+ Ne 9+ Fe 18+ Ne 9+ (baseline rates)