Download
1 / 10
100 likes | 358 Vues
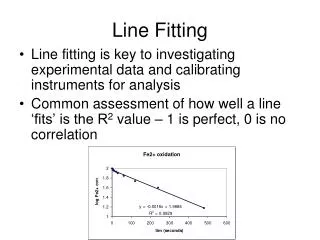
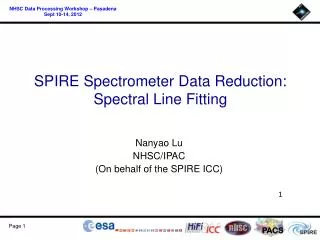
SPIRE Spectrometer Data Reduction: Spectral Line Fitting. Nanyao Lu NHSC / IPAC (On behalf of the SPIRE ICC). Goals. Briefly discuss the SPIRE FTS instrumental line shape. Demos on how to fit lines and derive line fluxes in SPIRE FTS spectra:

E N D
SPIRE Spectrometer Data Reduction: Spectral Line Fitting Nanyao Lu NHSC/IPAC (On behalf of the SPIRE ICC)
Goals • Briefly discuss the SPIRE FTS instrumental line shape. • Demos on how to fit lines and derive line fluxes in SPIRE FTS spectra: • Interactive line fitting with HIPE SpectrumFitter GUI. • Fit multiple lines (and multiple observations) using HIPE spectrum line fitting script.
Instrumental Line Shape The finite optical path difference (OPD ≤ L) leads to a truncated interferogram, which is equivalent to a convolution of the target spectrum with a SINC function in the spectral domain: S’() = S() sin(π/Δσ)/(π/Δσ) ], where = wavenumber (or frequency); Δσ= 1/(2L), the resolution element. SINC function Observed flux density True flux density • For an unresolved line: • S’() = I0sin[π(-0)/Δσ]/[π(-0)/Δσ]; • Flux = I0 Δσ; • FWHM = 1.207 Δσ. • (Δσ = 1.2 GHz in the High Resolution Mode) Flux density S’(σ) (Jy) Flux density Wavenumber σ (cm-1)
Reducing Side Lobes via Apodization Flux density • The concept ofApodizationis to further multiply an interferogramwith some gradually tapering function to depress measurements at highoptical path difference (OPD). The result is less side lobes from the SINC function at the cost of reduced spectral resolution. • The best apodization function is such that it suppresses the side lobe the most for a given degree of line profile broadening. A family of such optimal functions is shown to be the so-called extended Norton-Beer (NB) functions (cf. Naylor & Tahic 2007 (J. Opt. Soc. Amer, 24, 3644) • SPIRE FTS pipeline also provides a fully calibrated, apodized spectrum using the extended Norton-Beer function of order 1.5, or NB(1.5). The resulting line profile is about 50% wider in FWHM, appears similar to a Gaussian.
Pipeline Offers NB(1.5)-apodized Spectrum • The pipeline provides both unapodized and • NB(1.5)-apodizedspectra, with proper • flux calibration. • NB(1.5) line profile is not too different from • a Gaussian: a Gaussian fit to the NB(1.5) • line profile may lead to a flux overestimate • up to 5%. • Most accurate line flux can be obtained • by fitting a SINC function to the unapodized • spectrum. Apodized with NB(1.5) Unapodized Flux density
Spectral Resolving Power Depends on Wavelength FWHM ~ 750 km/s for CO J=5-4 line (at 576.3 GHz or 520 μm); σ/Δσ = λ/Δλ~ 480. IC342: a large galaxy FWHM ~ 296 km/s for [NII] 205um (at 1461 GHz or 205 μm); σ/Δσ = λ/Δλ~ 1218.
Caution on Partially Resolved Lines [NII] 205 μm @1461 GHz Ratio of (a) the flux from a Gaussian profile convolved with a SINC function to (b) that from a SINC profile, assuming: (1) Same observed line peak flux density in both cases; (2) The SINC function has a fixed FWHM = 1.207x1.2 = 1.45 GHz.
Summary Remarks • Pipeline offers properly calibrated NB(1.5)-apodizedspectrum with line profiles close to a Gaussian. • Fit lines in the un-apodized spectrum for most accurate fluxes. • Spectral resolving power (R = λ/Δλ) decreases as wavelength increases. • In most cases, astronomical lines are unresolved (by SPIRE FTS). So a continuum plus one (or more) SINC functions is an adequate model to fit. • Possible exceptions: [NII] 205um line in many galaxies, as well as some high-J CO lines in energetic objects, could be partially resolved. In these cases, a high S/N line profile is usually need to do a reliable Gaussian profile-convolved line fitting. • Various tools exist for fitting spectral lines and deriving line fluxes in SPIRE FTS spectra (see next slide).
Tools for SPIRE Spectral Line Analysis • Use SpectrumFitter GUI in HIPE for interactive fitting: • See Herschel Data Analysis Guide, Chapter 7. • Using a script within HIPE: • Hipe Scripts SPIRE Useful scripts Spectrometer Line Fitting. Also available: • Use Cassis as plug-in in HIPE • see http://cassis.cesr.fr/and the Cassis sessions at this workshop. • An IDL based Fitter (FTFitter). • Available athttp://www.uleth.ca/phy/naylor/index.php?page=ftfitter • Allows to fit a partially resolved line using a Gaussian profile convolved with the SINC instrumental line profile.
Demo on Line Fitting • Sample data: • OBSID = 1342189124 (NGC7027, HR, 17 Repeats). • Using the SpectrumFitter GUI in HIPE for interactive fitting: • See Herschel Data Analysis Guide, Chapter 7. • Using a script within HIPE: • Hipe Scripts SPIRE Useful scripts Spectrometer Line Fitting.