Section 5.4 Fitting a Line to Data
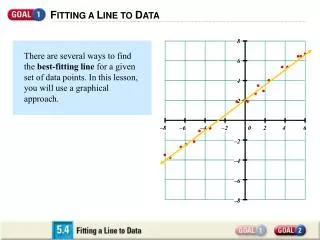
Section 5.4 Fitting a Line to Data. Objectives: Find a linear equation that approximates a set of data points Determine whether there is a positive or negative correlation or no correlation in a set of real-life data. Best-fitting line: the line that best fits all of the data points

Section 5.4 Fitting a Line to Data
E N D
Presentation Transcript
Section 5.4Fitting a Line to Data Objectives: Find a linear equation that approximates a set of data points Determine whether there is a positive or negative correlation or no correlation in a set of real-life data
Best-fitting line: the line that best fits all of the data points • Positive correlation means that the points can be approximated by a line with a positive slope • Negative correlation means that the points can be approximated by a line with a negative slope • Relatively no correlation means that the points cannot be approximated by a line • There is not a unique answer to the problems, you might get a different line that corresponds closely to the data. Vocabulary
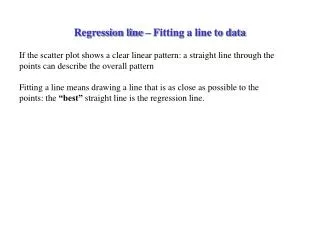
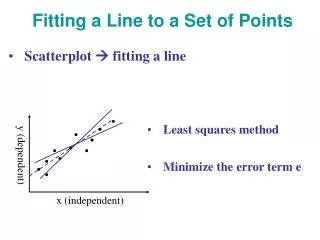
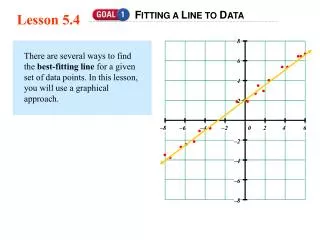
EX 1: Draw a scatter plot for the data. If possible, draw a line that corresponds closely to the data and write an equation of the line. Approximating a Best-Fitting Line
EX 2: Draw a scatter plot for the data. If possible, draw a line that corresponds closely to the data and write an equation of the line. Approximating a Best-Fitting Line
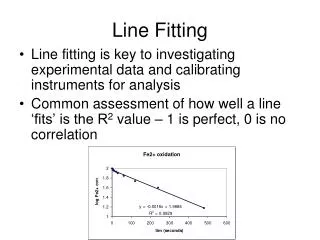
EX 3: State whether x and y have a positive correlation, a negative correlation, or relatively no correlation. Determining the Correlation of x and y
5.4 p. 29610 – 16 evens, 20 – 26 all,36 – 50 evens 19 questions