Line of Fit: Predicting Trends in Data
Learn how to find a line of fit for scattered data points to make predictions and understand real-world meanings. Discover the importance of slopes, intercepts, units, domains, and using lines of fit for predictions. Practice predicting wave completion times with varying group sizes and understand when linear models may not apply.

Line of Fit: Predicting Trends in Data
E N D
Presentation Transcript
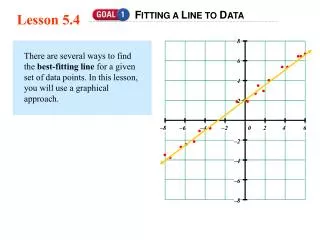
Fitting a Line to Data Lesson 3.3
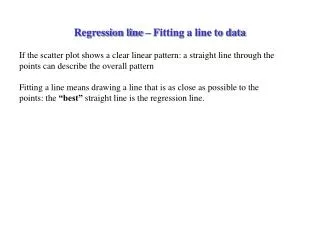
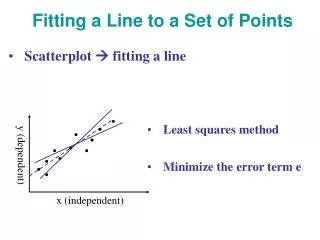
When you graph points from an arithmetic sequence, they lie on a line. • When you collect and graph real-life data, the points may appear to have a linear relationship. However, they will rarely lie exactly on a line. They will usually be scattered, and it is up to you to determine a reasonable location for the line that summarizes or gives the trend of the data set. • A line that fits the data reasonably well is called a line of fit. A line of fit can be used to make predictions about the data, so it is also called a prediction line.
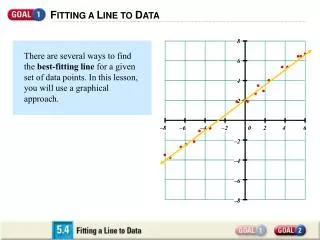
Finding a Line of Fit 1. Determine the direction of the points. The longer side of the smallest rectangle that contains most of the points shows the general direction of the line.
2. The line should divide the points equally. Draw the line so that there are about as many points above the line as below the line. The points above the line should not be concentrated at one end, and neither should the points below the line. The line has nearly the same slope as the longer sides of the rectangle.
Once you have drawn a line of fit for your data, you can write an equation that expresses the relationship. To indicate that the line is a prediction line, the variable , , is used in place of y.
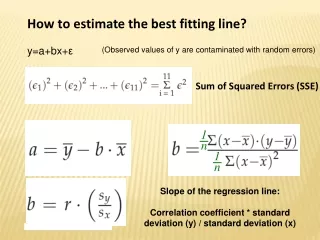
Point-Slope Form The formula for the slope is The equation of a line with slope b and containing point and any general point (x, y) is This is called the point-slope form for a linear equation.
Example • On a barren lava field on top of the Mauna Loa volcano in Hawaii, scientists have been monitoring the concentration of CO2 (carbon dioxide) in the atmosphere since 1959. This site is favorable because it is relatively isolated from vegetation and human activities that produce CO2. The average concentrations for 13 different years, measured in parts per million (ppm), are shown here.
Example • Find a line of fit to summarize the data. • Predict the concentration of CO 2 in the atmosphere in the year 2050.
The Wave • Sometimes at sporting events, people in the audience stand up quickly in succession with their arms upraised and then sit down again. The continuous rolling motion that this creates through the crowd is called “the wave.” You and your class will investigate how long it takes different-size groups to do the wave. • Using different-size groups, determine the time for each group to complete the wave. Collect at least nine pieces of data of the form (number of people, time), and record them in a table.
Plot the points, and find the equation of a reasonable line of fit. Write a paragraph about your results. Be sure to answer these questions: • What is the slope of your line, and what is its real-world meaning? • What are the x- and y-intercepts of your line, and what are their real-world meanings? • What is a reasonable domain for this equation? Why?
Domain could be integers starting at 0 and stopping at the class size of the class. The y-intercept is about 1.5 and represents the amount of time that the first person needs to stand up No meaning for the x-intercept of about -3.
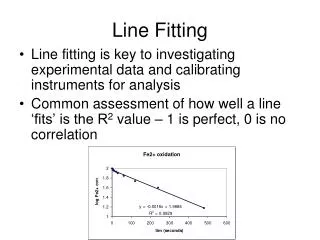
What are the units of the slope?” Seconds per person Why do we want a line of fit for a data set in the first place? We can use lines of fit to help us make predictions. We often say that we are going to extrapolate or interpolate the data to predict a new value.
Can you use your line of fit to predict how long it would take to complete the wave if 20 people in your class participated? Everyone in your class participated? Everyone at your school participated? Everyone in a large stadium? Explain why or why not. Yes, for 20 or your whole class. No, for a large group of people, the wave gains momentum and begins to travel faster. So for a large group of people, the data may not be linear.
What steps would you use to find an equation of a line of fit for a data set?