7.1 Fitting Data to a Line
110 likes | 264 Vues
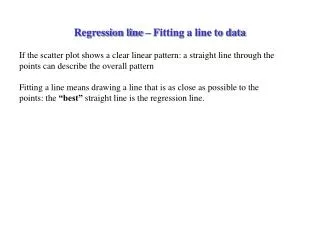
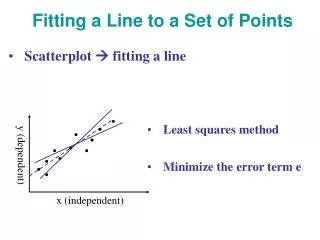
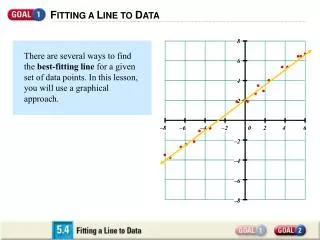
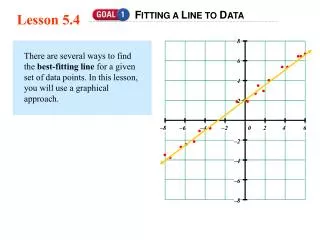
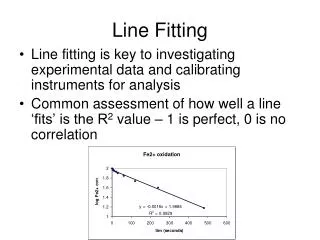
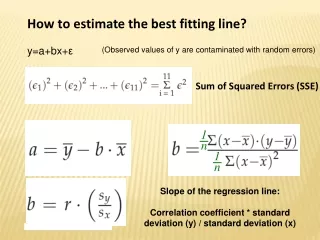
7.1 Fitting Data to a Line. Essential Question: How can we use math to predict the future? . Fitting a Line to Data. This is called three different things: Least Squares Regression Linear Regression Best Fit Line

7.1 Fitting Data to a Line
E N D
Presentation Transcript
7.1 Fitting Data to a Line Essential Question: How can we use math to predict the future?
Fitting a Line to Data • This is called three different things: • Least Squares Regression • Linear Regression • Best Fit Line • It involves estimating a line of fit for a scatter plot then finding the slope and y-intercept of the data • You can then plug in any x value to get a corresponding y-value – potentially predicting future data values that have not happened yet
Types of Correlation:Correlation is how closely the line matches the data (pts close together = good; pts spread out =bad) Positive Slope/Pts are close together Negative Slope/Pts are close together
Types of Correlation Continued No Correlation – can't really tell if it is positive or negative You cannot really draw a line that would fit all the data The data has a really bad r-value and potentially high standard deviation for "y" or output values
How do we use the calculator to find the best fit line/linear regression line/least square regression line? • Plug the data into your lists: Press Stat then Edit to go to the lists • Make sure it is referencing L1 and L2 • Enter data in each list (when putting in yearly data – always refer to the starting point as year zero) • After all data is entered: Press Stat – Right – 4-Enter to find the LinReg line • a is the slope • b is the y-int • You can plug in future values to find future data points
Median – Median Line • Find the mean, median, and std. dev for each data set below: • A) 1,5,7,486 B) 1,5,7,12 • Which data measure is unaffected by the outlier? • This is a line of best fit that is not influenced by outliers – similar to the way the median is not influenced by outliers in the data. • Which of the below would be the Median-Median line of the data red or green?
Correlation and Causation • An R-Value above 0.7 is a good positive correlation • An R-Value below -0.7 is a good negative correlation • A good correlation does not necessarily imply a causation. • Examples: • Hours of study correlated with test grades • Lower likelihood of cancer due to taking a certain pharmaceutical • When Michael Turner rushes more than 20 times the Falcons are 15-1 etc. • Correlation means there is a good mathematical relationship, so we can use it to predict future values. • Causation means that x caused y or vice versa – this is rarely true. • When given a scenario you can almost always argue there is no causation • There are times you can argue that a cause and effect relationship exists between the independent and dependant variables if you have a good reason the answer could be accepted.
Types of Samples Simple Random Sample (SRS) – best type of sample, each data point has an equal opportunity of being chosen Self Selected Sample – those in the population who chose to volunteer data are in the sample. Convenience Sample – those in the population who are easiest to reach are in the sample. Systematic Sample – a rule is used to sample, every fourth person is chosen, every other data point is chosen etc…. (this is probably the second best of these options)
Bias • How do we determine bias in a sample? • If a sample is biased it means that certain parts of the population are underrepresented. • Examples: Only sampling college students. • Internet surveys. • Measuring the average height and weight of American Males and declaring this is the average height and weight of humans.