Download
1 / 46
470 likes | 590 Vues
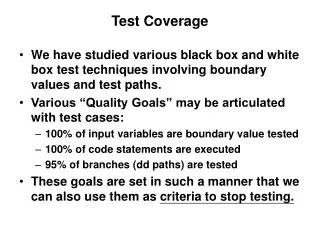
The Influence of Size and Coverage on Test Suite Effectiveness. International Symposium on Software Testing and Analysis, ISSTA 2009, Chicago, USA July 2009. Outline. Motivation Related work Experimental procedure Data analysis Case studies Discussion Conclusion and research direction.

E N D
The Influence of Size and Coverage on Test Suite Effectiveness International Symposium on Software Testing and Analysis, ISSTA 2009, Chicago, USA July 2009
Outline • Motivation • Related work • Experimental procedure • Data analysis • Case studies • Discussion • Conclusion and research direction
MotivationA Familiar Procedure: Coverage-based Test Adequacy Test Suite 0/3 0/20 Program P Coverage Degree (Line Coverage) Test Suite Effectiveness = Faults 3
MotivationA FamiliarProcedure: Coverage-based Test Adequacy Test Suite TC-1 1/3 9/20 Program P Coverage Degree (Line Coverage) Test Suite Effectiveness = Faults 4
MotivationA FamiliarProcedure: Coverage-based Test Adequacy Test Suite TC-2 TC-1 2/3 13/20 Program P Coverage Degree (Line Coverage) Test Suite Effectiveness = Faults 5
MotivationA FamiliarProcedure: Coverage-based Test Adequacy Test Suite TC-3 TC-2 TC-1 2/3 16/20 Program P Coverage Degree (Line Coverage) Test Suite Effectiveness = Faults 6
MotivationA FamiliarProcedure: Coverage-based Test Adequacy Test Suite TC-4 TC-3 TC-2 TC-1 2/3 18/20 Program P Coverage Degree (Line Coverage) Test Suite Effectiveness = Faults 7
MotivationA FamiliarProcedure: Coverage-based Test Adequacy Test Suite TC-5 TC-4 TC-3 TC-2 TC-1 3/3 20/20 Program P Coverage Degree (Line Coverage) Test Suite Effectiveness = Faults 8
Motivation(Known) Variables Involved in Coverage-based Test Adequacy Test Suite TC-5 TC-4 TC-3 TC-2 TC-1 3/3 20/20 Program P Coverage Degree (Line Coverage) Test Suite Effectiveness = Faults 9
MotivationCoverage Degree: The Influencing Variable Test Suite TC-5 TC-4 TC-3 TC-2 TC-1 3/3 20/20 Program P Coverage Degree (Line Coverage) Test Suite Effectiveness Influence? 10 = Faults
MotivationIs Coverage Degree the Only Influencing Variable? Test Suite TC-5 Size TC-4 TC-3 TC-2 TC-1 3/3 20/20 Influence? Program P Coverage Degree (Line Coverage) Test Suite Effectiveness Influence? 11 = Faults
MotivationThe Size of Test Suite has Increased from 1 to 5 Test Suite The purpose of this study TC-5 Size TC-4 TC-3 TC-2 TC-1 3/3 20/20 Influence? Program P Coverage Degree (Line Coverage) Test Suite Effectiveness Influence? 12 = Faults
MotivationThe Research Question • Is the effectiveness of a test suite because of: • Its size? • Its structural coverage degree? • What are the impacts of size and coverage on a test suite? 13
MotivationVisualizations – Relationships Between Pairs of Variables(2D) 14
MotivationVisualizations - Relationship Among All Three Variables (3D) 15
Related work • [Frankl and Weiss,1993; Frankl and Iakounenko, 1998] • Test suites that achieve higher coverage tend to be more effective (fault detection power) • Effectiveness is constant until high coverage levels are achieved at which point it increases rapidly • [Andrews et al.; 2005, 2006] • Mutants can act similarly to real faults • Study confirmed the linkage between coverage and effectiveness (mutant detection power) • Coverage-based test suites more effective than random-based test suites of the same size
Related workCont’d • [Rothermel et al., 2002] • The reduced test suites while preserving coverage are more effective than those that were reduced to the same size randomly eliminating test cases • In all above: • The support is indirect because the increase in effectiveness might be a result of the method of construction
Experimental ProcedureGoal and Approach • Goal - Study relationships among coverage degree, size and effectiveness • Approach • Generate a set of test suites of various sizes • Compute their coverage degree • Compute their mutant detection power • Apply appropriate statistical analysis to determine the relationship among: • Independent variables “size” and “coverage degree” • Dependent variable “mutant detection rate”
Experimental ProcedureTest suite generation and coverage measurement • For each program • 100 random-based test suites of each size from 1 to 50 • Variable “SIZE”, 0 < SIZE < 51 • For each test suite: • Measured the block, decision, C-use, and P-use coverage degrees using ATAC • Variable “CovDeg” with four instances for each of four coverage criterion • Conducting four similar analyses
Experimental ProcedureTest suite effectiveness • For each program • Re-used mutants from an earlier study [Siami Namin et al., 2008] • Using Proteum mutant generator • Also, for each test suite • Measured mutant detection rate “AM” • Test suite effectiveness
Experimental ProcedureDescription of subject programs – The Siemens set
Data AnalysisProportions of feasible coverage for all criteria using ATAC
Data AnalysisStatistical Techniques Applied • Visualizations – Shown earlier in this talk • ANCOVA • Principal component analysis • Correlation of coverage and effectiveness • Regression models
Data AnalysisANCOVA • Variables (factors) • Continuous dependent variable: Mutant detection rate • Continuous independent variable: Coverage degree • Discrete independent variable: Size • p-values • < 0.001 for the two independent variables (factors) • Both size and coverage degree strongly influence effectiveness • Often an interaction between two variables
Data AnalysisPurposes of Generating Regression Models • To determine whether: • including COVDEG in the models improves goodness of their fits • Transforming the data would affect the goodness of fits
Data AnalysisRegression Models Generated and Examined • AM | log(AM) ~ SIZE • AM | log(AM) ~ log(SIZE) • AM | log(AM) ~ COVDEG • AM | log(AM) ~ log(COVDEG) • AM | log(AM) ~ SIZE + COVDEG • AM | log(AM) ~ log(SIZE) + COVDEG • AM | log(AM) ~ SIZE + log(COVDEG) • AM | log(AM) ~ log(SIZE) + log(COVDEG)
Data AnalysisA Summary Comparison of the Regression Models • AM | log(AM) ~ SIZE + COVDEG: Better than • AM | log(AM) ~ SIZE • AM | log(AM) ~ COVDEG • AM | log(AM) ~ log(SIZE): Better than • AM | log(AM) ~ SIZE • Important indication: • Information about SIZE or COVDEG alone does not yield as good a prediction of effectiveness as information both SIZE and COVDEG
Data AnalysisThe Best Regression Model • AM | log(AM) ~ SIZE • AM | log(AM) ~ log(SIZE) • AM | log(AM) ~ COVDEG • AM | log(AM) ~ log(COVDEG) • AM | log(AM) ~ SIZE + COVDEG • AM | log(AM) ~ log(SIZE) + COVDEG • AM | log(AM) ~ SIZE + log(COVDEG) • AM | log(AM) ~ log(SIZE) + log(COVDEG)
Data AnalysisA summary of the linear models AM=B1.log(SIZE)+B2.CovDeg
Data AnalysisPredicted vs. actual AM for AM ~ B1.log(size)+B2.coverage
Data AnalysisPredicted vs. actual AM for AM ~ B1.log(size)+B2.coverage
Data AnalysisPredicted vs. actual AM for AM ~ B1.log(size)+B2.coverage
Data AnalysisPredicted vs. actual AM for AM ~ B1.log(size)+B2.coverage
Case StudiesCross-checking With Other Programs • gzip.c (SIR Repository) • 5680 LOC; 214 test cases • concordance.c • Introduced for the first time as a subject program • Originally developed by Ralph L. Meyer • Jamie Andrews at UWO • Organized the code into one single file • 13 real faults identified • 372 test cases designed (black-box testing) • 1490 LOC
Case StudiesMutants Generation for the Subject Programs of Case Studies • gzip.c • Used Proteum (Delamaro et al.) to generate mutants • 108 operators, 493402 mutants • Used the sufficient set of operators identified by Siami Namin et al. • 28 operators, 38621 mutants (7.8%) • For feasibility selected 1% of the sufficient set • 28 operators, 317 mutants • concordance.c • 867 non-equivalent mutants generated using the mutant generator used by Andrews et al.
Case StudiesProcedures for the Subject Programs of Case Studies • Similar procedure for generating test suites • Coverage tool: gcov • Line coverage • Mutant detection rates also computed
Case StudiesGoodness of fit of models measured by adjusted R2
Case Studies Predicted vs. actual AM for AM ~ B1.log(size)+B2.coverage
Case Studies Predicted vs. actual AF for AM ~ B1.log(size)+B2.coverage
DiscussionA Non-Linear Relationship among SIZE, COVDEG, and AM AM ~ B1.log(SIZE) + B2.COVDEG • Explaining log(SIZE) part of the model: • Harder to find faults • Adding a test case to a test suite improves the effectiveness if the added test case finds another faults • The detected faults by the added test case is likely to be revealed by the test suite • The added test case is unlikely to improve the effectiveness if the test suite is already big enough
DiscussionA Non-Linear Relationship among SIZE, COVDEG, and AM AM ~ B1.log(SIZE) + B2.COVDEG • Explaining COVDEG part of the model: • Faults associated with particular elements in the code • A test case exercising some elements associated with the faults is more likely to force a failure than one that does not • Regardless of the size of a test suite, a fault is more likely to be exposed by a test case if it covers new elements
DiscussionImplications for Software Testers • Achieving high coverage leads to higher effectiveness • Because of log(SIZE) +COVDEG • Achieving higher coverage becomes more important than size as size grows
Conclusion & Research DirectionsInfluence of SIZE and COVDEG on Effectiveness of Test Suites • Conclusion • Both SIZE and COVDEG independently influence the effectiveness • The relationship is not linear • AM ~ B1.log(SIZE) + B2.COVDEG • concordance.c as a new subject program • Future work • More experimental studies are needed • To validate the results • Validate generated models
Thank You International Symposium on Software Testing and Analysis, ISSTA 2009, Chicago, USA July 2009