Download
1 / 15
150 likes | 326 Vues
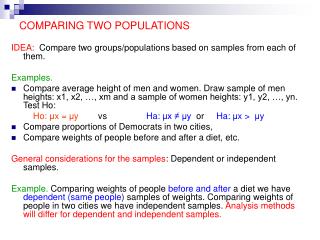
Unit 6 - Comparing Two Populations or Groups. Unit 6 - Comparing Two Populations or Groups. 12.2 Comparing Two Proportions 11.2 Comparing Two Means. Section 12.2 Comparing Two Proportions. Learning Objectives. After this section, you should be able to…

E N D
Unit 6 - Comparing Two Populations or Groups • 12.2 Comparing Two Proportions • 11.2 Comparing Two Means
Section 12.2Comparing Two Proportions Learning Objectives After this section, you should be able to… • DETERMINE whether the conditions for performing inference are met. • CONSTRUCT and INTERPRET a confidence interval to compare two proportions.
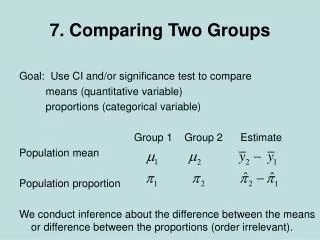
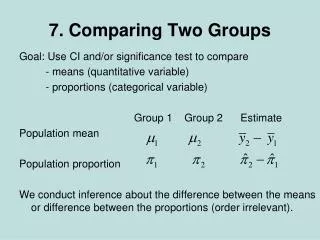
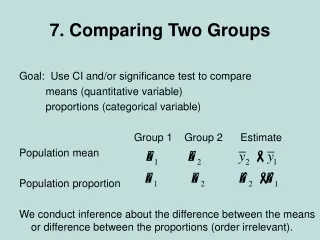
Comparing Two Proportions • Introduction Suppose we want to compare the proportions of individuals with a certain characteristic in Population 1 and Population 2. Let’s call these parameters of interest p1 and p2. The ideal strategy is to take a separate random sample from each population and to compare the sample proportions with that characteristic. What if we want to compare the effectiveness of Treatment 1 and Treatment 2 in a completely randomized experiment? This time, the parameters p1 and p2 that we want to compare are the true proportions of successful outcomes for each treatment. We use the proportions of successes in the two treatment groups to make the comparison. Here’s a table that summarizes these two situations.
Comparing Two Proportions • The Sampling Distribution of a Difference Between Two Proportions
Comparing Two Proportions • The Sampling Distribution of a Difference Between Two Proportions The Sampling Distribution of the Difference Between Sample Proportions Choose an SRS of size n1from Population 1 with proportion of successes p1and an independent SRS of size n2from Population 2 with proportion of successes p2.
Comparing Two Proportions • The Sampling Distribution of a Difference Between Two Proportions
Comparing Two Proportions • Example: Who Does More Homework? Suppose that there are two large high schools, each with more than 2000 students, in a certain town. At School 1, 70% of students did their homework last night. Only 50% of the students at School 2 did their homework last night. The counselor at School 1 takes an SRS of 100 students and records the proportion that did homework. School 2’s counselor takes an SRS of 200 students and records the proportion that did homework. School 1’s counselor and School 2’s counselor meet to discuss the results of their homework surveys. After the meeting, they both report to their principals that
Comparing Two Proportions • Confidence Intervals for p1 – p2 If the Normal condition is met, we find the critical value z* for the given confidence level from the standard Normal curve. Our confidence interval for p1 – p2is:
Comparing Two Proportions • Two-Sample z Interval for p1 – p2 Two-Sample zInterval for a Difference Between Proportions
Comparing Two Proportions • Example: Teens and Adults on Social Networks As part of the Pew Internet and American Life Project, researchers conducted two surveys in late 2009. The first survey asked a random sample of 800 U.S. teens about their use of social media and the Internet. A second survey posed similar questions to a random sample of 2253 U.S. adults. In these two studies, 73% of teens and 47% of adults said that they use social-networking sites. Use these results to construct and interpret a 95% confidence interval for the difference between the proportion of all U.S. teens and adults who use social-networking sites. State: Our parameters of interest are p1= the proportion of all U.S. teens who use social networking sites and p2= the proportion of all U.S. adults who use social-networking sites. We want to estimate the difference p1 – p2at a 95% confidence level. Plan: We should use a two-sample z interval for p1 – p2if the conditions are satisfied. • Random The data come from a random sample of 800 U.S. teens and a separate random sample of 2253 U.S. adults. • Normal We check the counts of “successes” and “failures” and note the Normal condition is met since they are all at least 10: • Independent We clearly have two independent samples—one of teens and one of adults. Individual responses in the two samples also have to be independent. The researchers are sampling without replacement, so we check the 10% condition: there are at least 10(800) = 8000 U.S. teens and at least 10(2253) = 22,530 U.S. adults.
Do: Since the conditions are satisfied, we can construct a two-sample z interval for the difference p1 – p2. Comparing Two Proportions • Example: Teens and Adults on Social Networks Conclude: We are 95% confident that the interval from 0.223 to 0.297 captures the true difference in the proportion of all U.S. teens and adults who use social-networking sites. This interval suggests that more teens than adults in the United States engage in social networking by between 22.3 and 29.7 percentage points.
Section 12.2Comparing Two Proportions Summary In this section, we learned that… • Choose an SRS of size n1from Population 1 with proportion of successes p1and an independent SRS of size n2from Population 2 with proportion of successes p2. • Confidence intervals and tests to compare the proportions p1and p2of successes for two populations or treatments are based on the difference between the sample proportions. • When the Random, Normal, and Independent conditions are met, we can use two-sample z procedures to estimate and test claims about p1 - p2.
Section 12.2Comparing Two Proportions Summary In this section, we learned that… • The conditions for two-sample z procedures are: • An approximate level C confidence interval for p1 - p2is where z* is the standard Normal critical value. This is called a two-sample z interval for p1 - p2.
Homework Chapter 12. #’s, 22, 23, 24.