Probability Theory
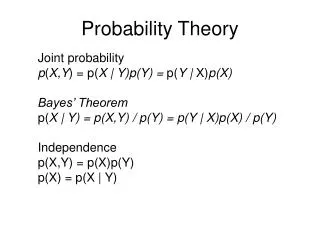
Probability Theory. Topics. Basic Probability Concepts: Sample Spaces and Events, Simple Probability, and Joint Probability, Conditional Probability Bayes ’ Theorem Probability Distribution. Sample Spaces . Collection of all Possible Outcomes e.g. All 6 faces of a die:


Probability Theory
E N D
Presentation Transcript
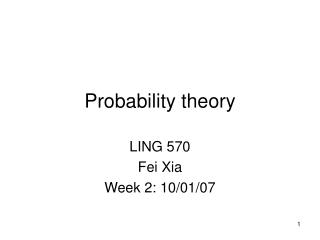
Topics • Basic Probability Concepts: • Sample Spaces and Events, Simple • Probability, and Joint Probability, • Conditional Probability • Bayes’ Theorem • Probability Distribution
Sample Spaces Collection of all Possible Outcomes e.g. All 6 faces of a die: e.g. All 52 cards of a bridge deck:
Events • Simple Event:Outcome from a Sample Space • with 1 Characteristic • e.g. A Red Card from a deck of cards. • Joint Event: Involves 2 Outcomes Simultaneously • e.g. An Acewhich is also aRed Cardfrom a • deck of cards.
Visualizing Events • Contingency Tables Ace Not Ace Total Black 2 24 26 Red 2 24 26 Total 4 48 52
Simple Events The Event of a Happy Face There are 5 happy faces in this collection of 18 objects
Joint Events The Event of a Happy Face AND Light Colored 3Happy Faces which are light in color
Special Events Null Event • Null event • Club & diamond on 1 card draw • Complement of event • For event A, • All events not In A:
Dependent or Independent Events The Event of a Happy Face GIVEN it is Light Colored E = Happy FaceLight Color 3Items:3 Happy Faces Given they are Light Colored
Contingency Table A Deck of 52 Cards Red Ace Not an Ace Total Ace Red 2 24 26 Black 2 24 26 Total 4 48 52 Sample Space
Contingency Table 2500 Employees of Company ABC Agree Neutral Opposed | Total MALE 200 400 | 1500 900 300 600 | 1000 FEMALE 100 2500 1000 | Total 1200 300 Sample Space
Tree Diagram Event Possibilities Ace Red Cards Not an Ace Full Deck of Cards Ace Black Cards Not an Ace
Probability • Probability is the numerical • measure of the likelihood • that the event will occur. • Value is between 0 and 1. • Sum of the probabilities of • all mutually exclusive and collective exhaustive events is 1. 1 Certain .5 0 Impossible
Computing Probability • The Probability of an Event, E: • Each of the Outcome in the Sample Space • equally likely to occur. Number of Event Outcomes P(E) = Total Number of Possible Outcomes in the Sample Space X e.g. P() = 2/36 = T (There are 2 ways to get one 6 and the other 4)
Computing Joint Probability The Probability of a Joint Event, A and B: P(A and B) Number of Event Outcomes from both A and B = Total Number of Possible Outcomes in Sample Space e.g. P(Red CardandAce) =
Joint Probability Using Contingency Table Event Total B1 B2 Event A1 P(A1andB1) P(A1andB2) P(A1) P(A2andB2) A2 P(A2) P(A2 and B1) 1 Total P(B1) P(B2) Marginal (Simple) Probability Joint Probability
Computing Compound Probability The Probability of a Compound Event, A or B: e.g. P(Red Card orAce)
Contingency Table 2500 Employees of Company ABC Agree Neutral Opposed | Total MALE 200 400 | 1500 900 300 600 | 1000 FEMALE 100 2500 1000 | Total 1200 300 Sample Space
The pervious table refers to 2500 employees of ABC Company, classified by gender and by opinion on a company proposal to emphasize fringe benefits rather than wage increases in an impending contract discussion • Calculate the probability that an employee selected (at random) from this group will be: • 1. A female opposed to the proposal
The pervious table refers to 2500 employees of ABC Company, classified by gender and by opinion on a company proposal to emphasize fringe benefits rather than wage increases in an impending contract discussion • Calculate the probability that an employee selected (at random) from this group will be: • 1. A female opposed to the proposal 600/2500 = 0.24
The pervious table refers to 2500 employees of ABC Company, classified by gender and by opinion on a company proposal to emphasize fringe benefits rather than wage increases in an impending contract discussion • Calculate the probability that an employee selected (at random) from this group will be: • 1. A female opposed to the proposal 600/2500 = 0.24 • 2. Neutral
The pervious table refers to 2500 employees of ABC Company, classified by gender and by opinion on a company proposal to emphasize fringe benefits rather than wage increases in an impending contract discussion • Calculate the probability that an employee selected (at random) from this group will be: • 1. A female opposed to the proposal 600/2500 = 0.24 • 2. Neutral 300/2500 = 0.12
The pervious table refers to 2500 employees of ABC Company, classified by gender and by opinion on a company proposal to emphasize fringe benefits rather than wage increases in an impending contract discussion • Calculate the probability that an employee selected (at random) from this group will be: • 1. A female opposed to the proposal 600/2500 = 0.24 • 2. Neutral 300/2500 = 0.12 • 3. Opposed to the proposal, GIVEN that • the employee selected is a female
The pervious table refers to 2500 employees of ABC Company, classified by gender and by opinion on a company proposal to emphasize fringe benefits rather than wage increases in an impending contract discussion • Calculate the probability that an employee selected (at random) from this group will be: • 1. A female opposed to the proposal 600/2500 = 0.24 • 2. Neutral 300/2500 = 0.12 • 3. Opposed to the proposal, GIVEN that • the employee selected is a female 600/1000 = 0.60
The pervious table refers to 2500 employees of ABC Company, classified by gender and by opinion on a company proposal to emphasize fringe benefits rather than wage increases in an impending contract discussion • Calculate the probability that an employee selected (at random) from this group will be: • 1. A female opposed to the proposal 600/2500 = 0.24 • 2. Neutral 300/2500 = 0.12 • 3. Opposed to the proposal, GIVEN that • the employee selected is a female 600/1000 = 0.60 • 4. Either a female or opposed to the • proposal
The pervious table refers to 2500 employees of ABC Company, classified by gender and by opinion on a company proposal to emphasize fringe benefits rather than wage increases in an impending contract discussion • Calculate the probability that an employee selected (at random) from this group will be: • 1. A female opposed to the proposal 600/2500 = 0.24 • 2. Neutral 300/2500 = 0.12 • 3. Opposed to the proposal, GIVEN that • the employee selected is a female 600/1000 = 0.60 • 4. Either a female or opposed to the • proposal ……….. 1000/2500 + 1000/2500 - 600/2500 = • 1400/2500 = 0.56
The pervious table refers to 2500 employees of ABC Company, classified by gender and by opinion on a company proposal to emphasize fringe benefits rather than wage increases in an impending contract discussion • Calculate the probability that an employee selected (at random) from this group will be: • 1. A female opposed to the proposal 600/2500 = 0.24 • 2. Neutral 300/2500 = 0.12 • 3. Opposed to the proposal, GIVEN that • the employee selected is a female 600/1000 = 0.60 • 4. Either a female or opposed to the • proposal ……….. 1000/2500 + 1000/2500 - 600/2500 = • 1400/2500 = 0.56 • 5. Are Gender and Opinion (statistically) independent?
The pervious table refers to 2500 employees of ABC Company, classified by gender and by opinion on a company proposal to emphasize fringe benefits rather than wage increases in an impending contract discussion • Calculate the probability that an employee selected (at random) from this group will be: • 1. A female opposed to the proposal 600/2500 = 0.24 • 2. Neutral 300/2500 = 0.12 • 3. Opposed to the proposal, GIVEN that • the employee selected is a female 600/1000 = 0.60 • 4. Either a female or opposed to the • proposal ……….. 1000/2500 + 1000/2500 - 600/2500 = • 1400/2500 = 0.56 • 5. Are Gender and Opinion (statistically) independent? • For Opinion and Gender to be independent, the joint probability of each pair of A events (GENDER) and B events (OPINION) should equal the product of the respective unconditional probabilities….clearly this does not hold…..check, e.g., the prob. Of MALE and IN FAVOR against the prob. of MALE times the prob. of IN FAVOR …they are not equal….900/2500 does not equal 1500/2500 * 1200/2500
Compound ProbabilityAddition Rule P(A1orB1 ) = P(A1) +P(B1) - P(A1 andB1) Event Total B1 B2 Event A1 P(A1and B1) P(A1and B2) P(A1) P(A2 andB1) A2 P(A2 and B2) P(A2) 1 Total P(B1) P(B2) For Mutually Exclusive Events: P(A or B) = P(A) + P(B)
Computing Conditional Probability The Probability of Event Agiven thatEvent B has occurred: P(A B) = e.g. P(Red Cardgiven that it isanAce) =
Conditional Probability Using Contingency Table Conditional Event: Draw 1 Card. Note Kind & Color Color Type Total Red Black Revised Sample Space 2 2 4 Ace 24 24 48 Non-Ace 26 26 52 Total
Conditional Probability and Statistical Independence Conditional Probability: P(AB) = Multiplication Rule: P(A and B) = P(AB) • P(B) = P(BA) • P(A)
Conditional Probability and Statistical Independence (continued) Events are Independent: P(AB) = P(A) Or, P(BA) = P(B) Or, P(A and B) = P(A) • P(B) Events A and B are Independent when the probability of one event, A is not affected by another event, B.
Bayes’ Theorem P(Bi A) = Adding up the parts of A in all the B’s Same Event
Bayes’ Theorem • Given a hypothesis H and an event E • P(H|E) = P(E|H) x P(H) • P(E) Where P(E) = P(E|H) x P(H) + P(E|H) x P(H)
Example • You have a physical complaint which is one of the symptoms of a rare and unpleasant disease. 1 in 500 people have the disease. The probability of having the physical symptom if you have the disease is 0.7. The probability of having the symptom without also having the disease is 0.01. • How likely is it that you are suffering from the disease?
Example • P(E) = P(E|H) x P(H) + P(E|H) x P(H) • P(E) = 0.7 x 0.002 + 0.01 x 0.998 = 0.01138 • P(H|E) = P(E|H) x P(H) • P(E) • P(H|E) = 0.7 x 0.002 = 0.123 • 0.01138
Probability Distribution Models Probability Distributions Continuous Discrete