Download
1 / 18
180 likes | 400 Vues
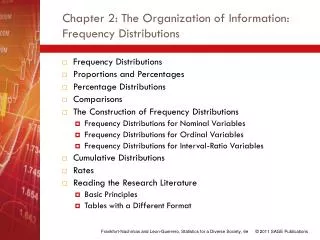
Chapter 2: The Organization of Information: Frequency Distributions. Frequency Distributions Proportions and Percentages Percentage Distributions Comparisons The Construction of Frequency Distributions Frequency Distributions for Nominal Variables

E N D
Chapter 2: The Organization of Information: Frequency Distributions • Frequency Distributions • Proportions and Percentages • Percentage Distributions • Comparisons • The Construction of Frequency Distributions • Frequency Distributions for Nominal Variables • Frequency Distributions for Ordinal Variables • Frequency Distributions for Interval-Ratio Variables • Cumulative Distributions • Rates • Reading the Research Literature • Basic Principles • Tables with a Different Format Frankfort-Nachmias and Leon-Guerrero, Statistics for a Diverse Society, 6e
Frequency Distributions • A table reporting the number of observations falling into each category of the variable. Frankfort-Nachmias and Leon-Guerrero, Statistics for a Diverse Society, 6e
Example: Death Penalty Statutes • In 1993, 36 states and Washington, D.C. had statutes permitting capital punishment. Of these 36 states, 27 set a minimum age for execution. Assume you are a member of a legal reform group that is trying to get the states that do not have a minimum age for execution to change their laws. You want to prepare a report describing the minimum age for execution in the 27 states have an established minimum age for execution. (The data are on the following slide.) Frankfort-Nachmias and Leon-Guerrero, Statistics for a Diverse Society, 6e
Death Penalty Statutes Source: Kathleen Maguire and Ann L. Pastore, eds., Sourcebook of Criminal Justice Statistics. 1994. U.S. Department of Justice, Bureau of Justice Statistics. Washington, D.C.: U.S. Government Printing Office, 1995, pp. 115-116. Frankfort-Nachmias and Leon-Guerrero, Statistics for a Diverse Society, 6e
Creating a Frequency Distribution Frankfort-Nachmias and Leon-Guerrero, Statistics for a Diverse Society, 6e
Proportions and Percentages • Proportion (P):a relative frequency obtained by dividing the frequency in each category by the total number of cases. • Percentage (%):a relative frequency obtained by dividing the frequency in each category by the total number of cases and multiplying by 100. • N:total number of cases • Proportions and percentages are relative frequencies Frankfort-Nachmias and Leon-Guerrero, Statistics for a Diverse Society, 6e
Proportions and Percentages Frankfort-Nachmias and Leon-Guerrero, Statistics for a Diverse Society, 6e
Percentage Distributions • A table showing the percentage of observations falling into each category of the variable. Frankfort-Nachmias and Leon-Guerrero, Statistics for a Diverse Society, 6e
Frequency Distributions for Nominal Variables Note: The categories for nominal variables (e.g., gender: male, female) need not be listed in any particular order. Frankfort-Nachmias and Leon-Guerrero, Statistics for a Diverse Society, 6e
Frequency Distributions for Ordinal Variables • Note: Because the categories or values of ordinal variables are rank-ordered, they must be listed in a way that reflects their rank-ordering from the lowest to the highest or from the highest to the lowest. Categories should be displayed in order. Frankfort-Nachmias and Leon-Guerrero, Statistics for a Diverse Society, 6e
Employment Status Example Frankfort-Nachmias and Leon-Guerrero, Statistics for a Diverse Society, 6e
Employment Status Example Frankfort-Nachmias and Leon-Guerrero, Statistics for a Diverse Society, 6e
Frequency Distributions for Interval-Ratio Variables Frankfort-Nachmias and Leon-Guerrero, Statistics for a Diverse Society, 6e
Cumulative Distributions • Sometimes we are interested in locating the relative position of a given score in a distribution. • Cumulative frequency distribution: a distribution showing the frequency at or below each category (class interval or score) of the variable. • Cumulative percentage distribution: a distribution showing the percentage at or below each category (class interval or score) of the variable. Frankfort-Nachmias and Leon-Guerrero, Statistics for a Diverse Society, 6e
Cumulative Frequency Distribution *Doesn’t total to 100% due to rounding. Frankfort-Nachmias and Leon-Guerrero, Statistics for a Diverse Society, 6e
Cumulative Percentage Distribution *Does not total 100% due to rounding Frankfort-Nachmias and Leon-Guerrero, Statistics for a Diverse Society, 6e
Rates A number obtained by dividing the number of actual occurrences in a given time period by the number of possible occurrences. What’s the problem with the “rate” computation below? Why is it not an accurate statistic? Marriage rate, 1990 = Number of marriages in 1990 Total population in 1990 Marriage rate, 1990 = 2,448,000 marriages 250,000,000 Americans Marriage rate, 1990 = .0098 Frankfort-Nachmias and Leon-Guerrero, Statistics for a Diverse Society, 6e
Reading Statistical Tables Basic principles for understanding what the researcher is trying to tell you: • What is the source of the table? • How many variables are presented? What are their names? • What is represented by the numbers presented in the first column? In the second column? Frankfort-Nachmias and Leon-Guerrero, Statistics for a Diverse Society, 6e