Download
1 / 1
10 likes | 239 Vues
cloud. cloud. NDVI map. NDVI map. MSG weekly MSG daily AVHRR weekly AVHRR weekly (running average). cloud. cloud. NDVI map. NDVI map. Weekly max NDVI composite averaged within 1x1 deg area. NOAA-18 AVHRR (derived from 16 km GVIx). MSG SEVIRI

E N D
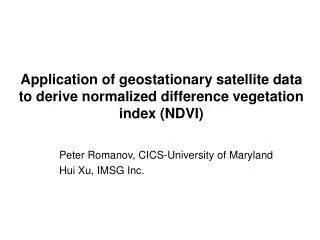
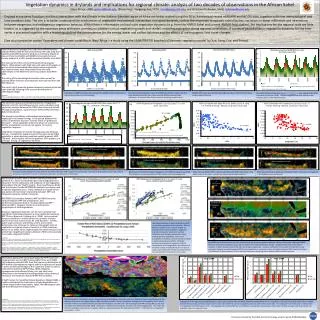
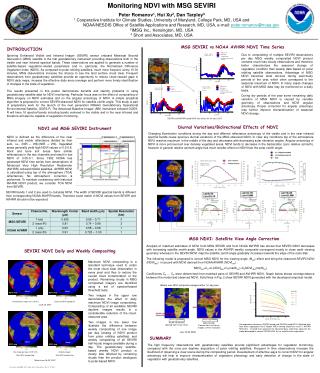
cloud cloud NDVI map NDVI map MSG weekly MSG daily AVHRR weekly AVHRR weekly (running average) cloud cloud NDVI map NDVI map Weekly max NDVI composite averaged within 1x1 deg area NOAA-18 AVHRR (derived from 16 km GVIx) MSG SEVIRI Derived from half-hourly images at 4 km resolution July 16-22 2006 MSG weekly MSG daily AVHRR weekly AVHRR weekly (running average) Monitoring NDVI with MSG SEVIRI Peter Romanov1, Hui Xu2, Dan Tarpley3 1 Cooperative Institute for Climate Studies, University of Maryland, College Park, MD, USA and NOAA/NESDIS Office of Satellite Applications and Research, MD, USA, e-mail: peter.romanov@noaa.gov 2IMSG Inc., Kensington, MD, USA 3 Short and Associates, MD, USA MSG SEVIRI vs NOAA AVHRR NDVI Time Series INTRODUCTION Spinning Enhanced Visible and Infrared Imager (SEVIRI) sensor onboard Meteosat Second Generation (MSG) satellite is the first geostationary instrument providing observations both in the visible and near infrared spectral bands. These observations are applied to generate a number of satellite-based vegetation-related parameters and in, particular, the Normalized Difference Vegetation Index (NDVI). As compared to polar orbiting satellites, much more frequent, every 15-30 minutes, MSG observations increase the chance to see the land surface cloud clear. Frequent observations from geostationary satellites provide an opportunity to reduce cloud-caused gaps in NDVI daily maps, increase the effective daily area coverage and perform more timely identification of changes in the state of vegetation. The results presented in this poster demonstrate benefits and identify problems in using geostationary satellite data for NDVI monitoring. Particular focus was on the effect of compositing of MSG imagery on NDVI estimates and on the angular anisotropy of NDVI. A simple analytical algorithm is proposed to correct SEVIRI-observed NDVI for satellite zenith angle. This study is part of preparatory work for the launch of the next generation NOAA’s Geostationary Operational Environmental Satellite, GOES-R. The Advanced Baseline Imager (ABI) instrument onboard GOES-R will have 16 spectral bands including bands centered in the visible and in the near infrared and therefore will also be capable of vegetation monitoring. Due to compositing of multiple SEVIRI observations per day MSG weekly composited NDVI product contains much less cloudy observations and therefore better characterizes the seasonal change of vegetation condition than weekly data based on polar orbiting satellite observations. Advantage of MSG NDVI becomes most obvious during wet/cloudy periods of the year, which often correspond to the seasonal maximum of NDVI. In many cases changes of NDVI with MSG data may be monitored on a daily basis. During dry periods of the year some remaining daily variation of MSG NDVI is caused by variable geometry of observations and NDVI angular anisotropy. Proper correction for angular anisotropy may further improve characterization of seasonal NDVI change. SEVIRI and AVHRR-based NDVI time series for the year 2007. Diurnal Variations/Bidirectional Effects of NDVI NDVI and MSG SEVIRI Instrument Changing illumination conditions during the day and different reflectance anisotropy of the visible and in the near infrared spectral bands cause spurious diurnal variations of the MSG-observed NDVI. In clear sky conditions top of the atmosphere NDVI reaches maximum in the middle of the day and decreases with decreasing solar elevation angles. Angular anisotropy of NDVI is more pronounced over densely vegetated areas. NDVI tends to decrease in the backscatter (zero relative azimuth), however in general relative azimuth angle has much smaller effect on NDVI than the solar zenith angle. NDVI is defined as the difference of the near infrared and visible reflectance divided by their sum, i.e., (NIR – VIS)/(NIR + VIS). Vegetated areas generally yield high NDVI values of 0.5-0.8. Rock and bare soil areas have similar reflectances in the two channels and result in low NDVI of 0.05-0.1. Since 1982 NOAA has generated NDVI time series from observations of Advanced Very High Resolution Radiometer (AVHRR) onboard NOAA satellites. AVHRR NDVI is calculated using top of the atmosphere (TOA) reflectances. No atmospheric correction is performed. To maintain consistency with historical AVHRR NDVI product, we consider TOA NDVI from SEVIRI. SEVIRI bands 1 and 2 are used to calculate NDVI. The width of SEVIRI spectral bands is different from corresponding NOAA AVHRR bands. Therefore exact match of NDVI values from SEVIRI and AVHRR should not be expected. MSG NDVI: Satellite View Angle Correction Analysis of matched estimates of NDVI from MSG SEVIRI and from NOAA AVHRR has shown that SEVIRI NDVI decreases with increasing satellite zenith angle. NDVI values in the AVHRR weekly composite correspond mostly to close nadir viewing geometry whereas in the SEVIRI NDVI map the satellite zenith angle gradually increases towards the edge of the scan disk. The following model is proposed to correct MSG NDVI for the viewing angle (Θsat) effect and bring the observed SEVIRI NDVI (NDVIobs) in accord with NDVI derived from NOAA AVHRR (NDVIcor) : NDVIcor=C0+C1NDVIobs+C2cos(Θsar)+C3NDVIobscos(Θsar) Coefficients C0 … C3 were determined from matched pairs of SEVIRI and AVHRR NDVI. Graph below shows correspondence between the model and observed NDVI. Solid lines in Fig. 2 show SEVIRI NDVI generated with the developed empirical model. SEVIRI NDVI Daily and Weekly Compositing Maximum NDVI compositing is a standard technique used to retain the most cloud clear observation in every pixel and thus to reduce the overall cloud contamination of the product. Remaining clouds in MSG composited imagery are identified using a set of spectral-based threshold tests. Two images in the upper row demonstrate the effect of daily maximum NDVI image compositing. Compositing of all available SEVIRI daytime images results in a considerable reduction of the cloud-obscured area. Two images in the lower row illustrate the difference between weekly compositing of one image per day (analog of NDVI product from polar orbiting satellites) and weekly compositing of all SEVIRI half-hourly images available during a day. The geostationary satellite-based weekly NDVI product is clearly less affected by remaining clouds than the product analogous to polar-based NDVI. Instantaneous image at 13.15 UTC Daily max NDVI composite June 23, 2007 Correspondence between AVHRR-based and SEVIRI-based NDVI. Matched data have been aggregated into 5 degree MSG viewing angle bins and 0.1 AVHRR NDVI bins. Dashed lines represent the observed data, solid lines represent the model developed to correct SEVIRI NDVI for the satellite view angle effect. SUMMARY The high frequency observations with geostationary satellites provide significant advantages for vegetation monitoring, compared with the once per daytime acquisition of polar orbiting satellites. Frequent in time observations increase the likelihood of observing a clear scene during the compositing period. Development of effective ways to correct NDVI for angular anisotropy will help to improve characterization of vegetation phenology and early detection of change in the state of vegetation with geostationary satellites. One image per day (13.15 UTC) Max NDVI compositing All daily images Max NDVI compositing Week June 16-23, 2007 Presented at IGARSS 2009, Cape Town, South Africa, July 13-17 2009