r 2 (NDVI- Precip )
20 likes | 166 Vues
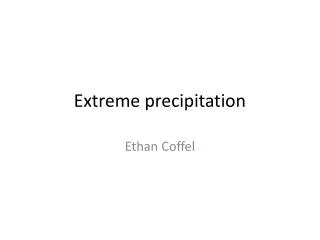
Vegetation dynamics in drylands and implications for regional climate: analysis of two decades of observations in the African Sahel Steve Prince, UMD, sprince@umd.edu (Presenting) , Yongkang Xue , UCLA, yxue@geog.ucla.edu , and Khaldoun Rishmawi , UMD, rishmawi@umd.edu

r 2 (NDVI- Precip )
E N D
Presentation Transcript
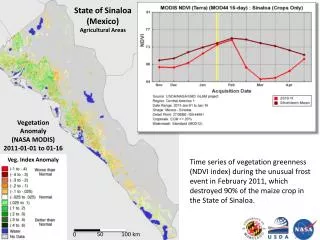
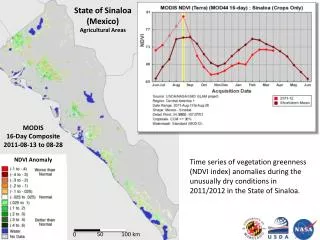
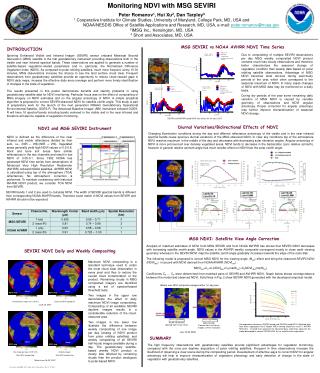
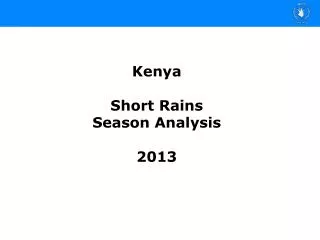
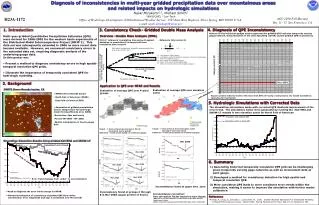
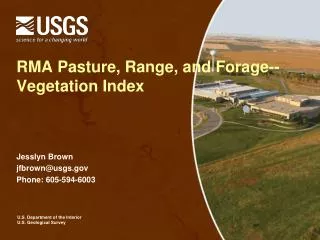
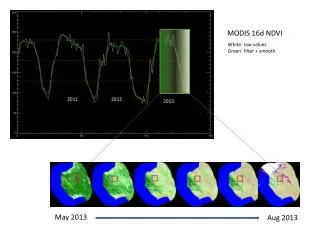
Vegetation dynamics in drylands and implications for regional climate: analysis of two decades of observations in the African Sahel Steve Prince, UMD, sprince@umd.edu(Presenting) , YongkangXue, UCLA, yxue@geog.ucla.edu, and KhaldounRishmawi, UMD, rishmawi@umd.edu Drylandecosystems functions and their interactions with the climate in the Sudano-Sahelian region of Africa are being studied using the 30 yr, harmonized record of AVHRR and MODIS data, together with new meteorological and land condition data. The aim is to better understand the mechanisms of vegetation-environment interactions in tropical drylands, such as the responses to episodic rainfall pulses, variations in water infiltration and interactions between exogenous and endogenous vegetation behavior. While there is information on local scale vegetation dynamics (e.g. from the HAPEX-Sahel and current AMMA field studies), the implications for the regional scale are little known, as is suggested by the extensive areas with poor correlations between annual vegetation growth and rainfall, notwithstanding the strong regional correlations. A survey of periodicities in vegetation dynamics for the time-series is presented together with a modeling study of the consequences for the energy, water and carbon balances and the effects of anthropogenic land cover changes.(See also companion poster 'Ecosystem and climate variability in West Africa – a study using the SSiB4/TRIFFID biophysical/dynamic vegetation model' by Xue, Song, Cox, and Prince). Daily Global Area Coverage (GAC) data from AVHRR sensors onboard NOAA satellites was processed by the Land Long Term Data Record (LTDR) project to produce a consistent long term data set from the AVHRR and MODIS instruments for land climate Studies at a 0.05o spatial resolution (Pedelty et al 2007). The data were further corrected for geometrical angular effects. Observations with high solar and view zenith angels as well as cloud contaminated observations were masked out. The masked values were interpolated from the valid observations in the NDVI time series to produce daily NDVI data. The timing of the phenological transition dates as well as seasonal NDVI minimum and maximum were derived from the NDVI data set. The result (right) show the greater temporal resolution that has been achieved, allowing more precise identification of phenological stages. REFERENCES: Pedelty, J., S. Devadiga, E. Masuoka, M. Brown, J. Pinzon and C. Tucker (2007). Generating a Long-term Land Data Record from the AVHRR and MODIS Instruments. IEEE International Geoscience and Remote Sensing Symposium. Barcelona, Spain. Parameters for BRDF correction were derived from MODIS directional reflectance signatures (Vermote et al; forthcoming) . The cloud masking algorithm masks all AVHRR red reflectance values less than three standard deviations from mean monthly MODIS measured cloud reflectance. A temporal filter further removes remaining suspect values. Masked NDVI values are estimated from adjacent values in the NDVI time series using quadratic functions. Sinusoidal functions of the form were used to fit the NDVI time series (Friedlet al 2003). The phenological events were defined as the inflection points of the fitted functions. The dominant spatial and temporal patterns of vegetation dynamics and the controlling processes were evaluated using regression analysis between the NDVI time series and climate forcings (precipitation, vapor pressure deficit (VPD) and mean daily temperature). The strongest correlation relationships were between vegetation and climate forcings in the period between the onset of “greenness increase” and the onset of “greenness decrease”. Once vegetation enters the phase of senescence, further precipitation events do not appear to result in vegetation response. Vegetation responses to climatic forcings also vary between biomes. Precipitation explains most of the intra-annual NDVI variability in areas receiving moderate rainfall amounts (400-700 mm). At the wetter end of the gradient, VPD appears as a principal forcing of vegetation dynamics. (A) (B) Correlation between precipitation and NDVI (A) onset of “greenness increase” (C) onset of “greenness Decrease” Correlation between VPD and NDVI Correlation between temperature and NDVI (B) onset of “greenness Maximum” (D) onset of “Dormancy” (C) Root mean squared error Root mean squared error Root mean squared error Timing of the phenological transition dates for the Sahel in the year 1982. Values are in day of year. (A) onset of “greenness increase”, (B) onset of “greenness maximum”, (C) onset of “greenness decrease”, and (D) onset of “dormancy”. (A) Period of correlation between precipitation p and NDVI for a grassland and (B) for the Sahel. p is a good predictor of NDVI in areas with intermediate p (C). Vapor pressure deficit (VPD) is inversely correlated with NDVI, particularly in the wetter areas of the Sahel , possibly by influencing stomatal resistance. Mean daily temperature positively correlated to NDVI in the Sahel, but negatively in the Sudanian zone to the south. Identification of areas near or at their primary productivity potential (i.e. areas not showing signs of land degradation) is important for the calibration and validation of Soil Vegetation Atmosphere Transfer (SVAT) models. Rain Use Efficiency (RUE) and the Residual Trends (RESTREND) methods have been used to identify degraded areas. These methods are based on the assumption of near-linear relationship between NPP and integrated seasonal rainfall in drylands . RESTREND (1) estimates Potential NPP (or NDVI) from the relation between NPP and precipitation, and (2) Derives temporal trends in residuals (potential NPP – observed NPP). Negative trends are interpreted as symptomatic of land degradation. However, vegetation dynamics can be more complex than equilibrial relationships between annual rainfall and seasonal NPP (Prince, Brown de Colstoun et al. 1998). Intra-seasonal temporal variation in rainfall affects the quantity of water stored in the root zone that can be used by plants. Further, water vapor pressure, soil fertility, and to some extent temperature are all known to influence the growth rates of vegetation in drylands (Caylor, Dowty et al. 2004; Sankaran, Hanan et al. 2005), which might explain the observed poor and sometimes insignificant relations between NDVI and seasonally or annually integrated rainfall. REFERENCES: Prince, S. D., E. Brown de Colstoun and L. Kravitz (1998). "Evidence from rain use efficiencies does not support extensive Sahelian desertification." Global Change Biology 4(4): 359-374. Caylor, K. K., P. R. Dowty, H. H. Shugart and S. Ringrose (2004). "Relationship between small-scale structural variability and simulated vegetation productivity across a regional moisture gradient in southern Africa." Global Change Biology 10(3): 374-382. Sankaran, M., N. P. Hanan, R. J. Scholes, J. Ratnam, D. J. Augustine, B. S. Cade, J. Gignoux, S. I. Higgins, X. Le Roux, F. Ludwig, J. Ardo, F. Banyikwa, A. Bronn, G. Bucini, K. K. Caylor, M. B. Coughenour, A. Diouf, W. Ekaya, C. J. Feral, E. C. February, P. G. H. Frost, P. Hiernaux, H. Hrabar, K. L. Metzger, H. H. T. Prins, S. Ringrose, W. Sea, J. Tews, J. Worden and N. Zambatis (2005). "Determinants of woody cover in African savannas." Nature 438(7069): 846-849. r2 (NDVI-Precip) (A) (B) Inter-annual variation in Rain Use Efficiency (RUE) in crop lands, grasslands and shrublands. Rain use efficiency appears to be inversely related to growing season total precipitation. Suggested mechanisms include: reductions in rainfall infiltration rates at higher precipitation totals limiting nutrients availability; intra-annual precipitation variability; and inter-annual variability in water vapor pressure deficits. Although persistent and long-term reductions in RUE is symptomatic of land degradation, the influence of the other climatic and edaphic factors on rates of carbon assimilation add interesting complexities to the interpretation of temporal trends in RUE. r2 (Residuals-Time) (C) (A) Coefficient of determination (r2) of an ordinary least square linear regression between 20 years of annually integrated GIMMS NDVI and UEA CRU precipitation values. (B) The slope of the residuals (Residual Trends) indicates limited areas of persistent reduction in NDVI, whereas most of the Sahel shows signs of greening. However, confidence in the results is limited due to low correlation between annually integrated NDVI and precipitation on one hand and low correlation between NDVI residuals and time. (C) Coefficient of determination (r2) of an ordinary least square linear regression between NDVI residuals and time. Alternative approaches to estimate potential NPP have been proposed such as Local NPP Scaling (LNS; Prince et al 2009). LNS estimates potential NPP from the frequency distribution of NPP within a homogeneous region and then expresses all pixels in terms of their percentage of the maximum, which is used to estimate the potential NPP (Pickup 1996). Mapping homogenous areas allows climate, soil, and land cover differences to be normalized and degradation to be detected relative to the maximum observed NPP (Prince 2002). A SVAT model, the Simplified Simple Biosphere Model (SSIB), is used to understand the implications of land degradation on carbon sequestration (see panels, right), the hydrological cycle and land-atmosphere energy fluxes. REFERENCES: Pickup, G. (1996). "Estimating the effects of land degradation and rainfall variation on productivity in rangelands: an approach using remote sensing and models of grazing and herbage dynamics." Journal of Applied Ecology 33: 819-832. Prince, S. D. (2002). Spatial and temporal scales of measurement of desertification. Global desertification: do humans create deserts? M. Stafford-Smith and J. F. Reynolds. Berlin, Dahlem University Press: 23-40. S.D. Prince, I. Becker-Reshef, K. Rishmawi (2009). "Detection and mapping of long-term land degradation using local net production scaling: Application to Zimbabwe." Remote Sensing of Environment, Volume 113, Issue 5 (A) (B) (A) Land capability classification results. Climate forcings and landcover data were used in an iterative k-means classification with the objective to minimize correlation between NDVI and input variables. These are assumed “homogenous land capability units” where variation in NDVI is not explained by the principal climatic factors and land cover. (B) Percentage Local NPP Scaling (LNS) results were calculated from MODIS data (2001-2008). Reductions in NDVI from the potential are likely areas of land degradation. The mean LNS values for validation sites (source: G. Tappan, USGS ) are significantly lower for degraded sites (%LNS = -17%) than for non-degraded sites (%LNS = -2.4%). Comparison of non degraded and degraded sites using results obtained from Simplified Simple Biosphere Model Version 2 (SSIB-2) runs forced with climate observations, AVHRR derived leaf area index and fraction cover data for two sites within the same land capability class and with similar climate data. The “degraded” site %LNS value is -22% and the “not degraded” site %LNS value is -11%. The degraded site modeled NPP per unit Infiltration, soil wetness, transpiration, stress index and RUE are lower than those of the not-degraded site for the two years runs. This work is funded by the NASA Terrestrial Ecology program (grant # NNX08AL56G)