Download
1 / 22
220 likes | 322 Vues
Learn to import, manipulate, and link data across programs and sources for urban research projects. Explore leveraging text, HTML, pictures, and databases efficiently. Enhance your research productivity.

E N D
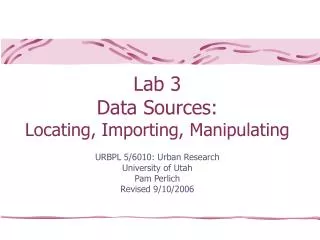
Lab 3Data Sources: Locating, Importing, Manipulating URBPL 5/6010: Urban Research University of Utah Pam Perlich Revised 9/10/2006
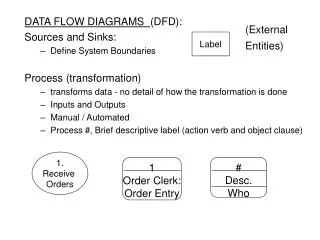
Objectives • Pasting from other programs • Importing from other programs • Text • HTML • Picture • Database • Federal statistical agency web sites
Files for Lab 3 • CopyData.doc • CopyData.txt • TextColumns.xls • Database.mdb
Link Data to Other ProgramsCopyData.doc • Open the word file • Select the text to be copied • Open Excel – Explore different paste options • Paste • Paste special • Text • MS word object • MS word object paste link • Change text in original document and it will update in the spreadsheet as well. • Picture • Go to a website and copy a graphic • Paste this into Excel
Importing Delimited Text DataCopyData.txt • Open CopyData.txt in a text editor and examine contents • Data => Import (as delimited) • Files can be comma, quote, comma and quote, or tab delimited • Delimiters interpret and format the data
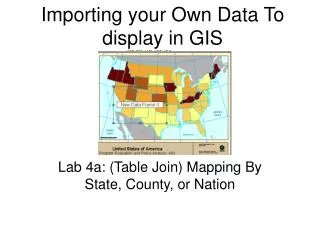
Importing Fixed Width Data • www.census.gov • Select People & Households Historical Census Data Item 17: Urban and Rural Populations: 1900 to 1990 • Save this file to your computer (urpop0090.txt) • Examine the file in a text editor • Import it to Excel • Note: the title lines are not important. Just import the data to create a clean data set. It is a fixed width file.
Changing Text to ColumnsTextColumns.xls • Open the file • Select the cell that contain data • Data =>Text to columns • Fixed width • Specify dividing columns • Finish
Import Database FilesDatabase.mdb • Open Excel • Data => Import External Data => Import Data • Point to the database file • Examine the “properties” choices • Import to a new worksheet • Explore the record based nature of a database file
Web Files • Import from a web page • Data => import external data => new web query • Navigate to www.bls.gov • Select any page of data and import • Alternative methods • Try to copy a data table from the web site and paste into Excel • Save data as HTML file then import it to Excel • Many organizations are building much better data downloading functionality into their websites.
File Export • Explore the file save as options • Try a few of these to test the results.
Federal Statistical Agencies • Bureau of the Census • Bureau of Labor Statistics • Bureau of Economic Analysis
American Factfinder • www.census.gov • American Factfinder • Click on “About the Data” and review the contents • Types of tables – Quick tables, geographic comparison tables, etc. • Data sets – Decennial census, ACS, etc. • Select each top level menu and examine contents – Population finder, fact sheet, etc.
AFF Features – Project 2 • Data sets Decennial Census Census 2000 SF1 List all tables • Study the types – Quick tables, geographic comparison table, detailed tables (population and household) • Select P37: Group Quarters Population by Group Quarters Type Next
Select “All Places” Then “Add” Then “Show Result”
AFF: Custom Tables & Geo within Geo • Select data sets to return to data menu • Select SF1 Custom Tables • Select “Geo within Geo” • Show me all the “Places” within a “County” Select geography of your choice • Select P1 – Population; P37 – Population in Group Quarters; P16 – Population in Households • Select which data elements you need Show results. • Explore the filtering option • Get you data into Excel and format it
AFF: Explore Other Available Data Sets and Functions • Click “FAQ” • Click “How to Use it” • Spend some time reviewing this • If students have specific research issues, have the lab assemble the data.