Download
1 / 27
270 likes | 432 Vues
Global Emissions from the Agriculture and Forest Sectors: Status and Trends. Indu K Murthy Indian Institute of Science. GHG emissions accelerate despite reduction efforts. Most emission growth is CO 2 from fossil fuel combustion and industrial processes.

E N D
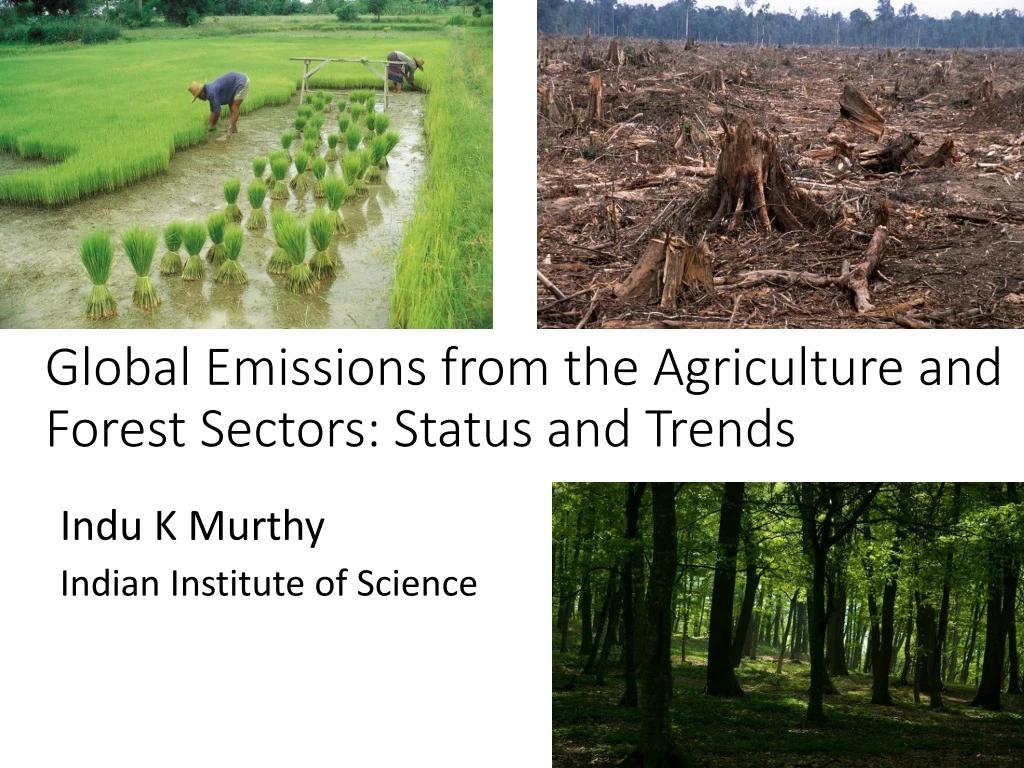
Global Emissions from the Agriculture and Forest Sectors: Status and Trends Indu K Murthy Indian Institute of Science
GHG emissions accelerate despite reduction efforts. Most emission growth is CO2 from fossil fuel combustion and industrial processes
Total anthropogenic GHG emissions by economic sectors (GtCO2eq/yr)
Agriculture, Forestry and Other Land Use (AFOLU) • Agriculture, Forestry, and Other Land Use plays a central role for food security and sustainable development. • Land is the critical resource for the AFOLU sector • Supporting a population of ~7 billion, • AFOLU activities generate CO2 emissions by sources (e. g., deforestation, peatland drainage) as well as removals by sinks (afforestation, management for soil carbon sequestration) and non-CO2 emissions primarily from agriculture • CH4 from livestock and rice cultivation • N2O from manure storage and agricultural soils and biomass burning
Growth Rate of AFOLU Emissions • Over the period 1990-2010, total AFOLU net emissions increased by 8% • from an average of 7,497 Mt CO2 eq in the 1990s to an average of 8,103 Mt CO2 eq in the 2000s • This was a result of • Increases in agriculture emissions by 8% • Decreases in Forest and Other LU (FOLU) emissions by -14%, due to a slow-down in net forest conversion • Decreases in FOLU removals by 36% • Contribution by Sub-Sectors
According to EDGAR and FAOSTAT, emissions from enteric fermentation are largest emission sources. • US EPA - emissions from agricultural soils are the dominant source. • All databases agree that that enteric fermentation and agricultural soils represent together about 70% of total emissions followed by: • Paddy rice cultivation (9–11%) • Biomass burning (6–12%) • Manure management (7–8%) • Annual total non-CO2 GHG emissions from agriculture in 2010 are estimated to be 5.2–5.8 GtCO2eq/yr, comprising for 10–12% of global anthropogenic emissions. • Between 1990 and 2010, agricultural non-CO2emissions grew by 0.9%/yr, with a slight increase in growth rates after 2005.
Greenhouse gas emissions from agricultural soils consist of methane and nitrous oxide produced in sub-sectors • Synthetic fertilizers • Manure applied to soils • Manure left on pasture • Crop residues • Cultivation of organic soils • 2011 emissions (FAO, 2015)
Trends in Agricultural Emissions Manure applied to soils Synthetic fertilizers Manure left on soils Crop residue
2000-2010Emissions have grown most in AfricaIn both Asia (2.0%/yr) and the Americas emissions grew more slowly • From 2000 to 2010, cattle contributed the largest share (75% of the total), followed by buffalo, sheep and goats
In 2011, world total annual GHG emissions from manure management were 361 Mt CO2eq, (about 7% of total emissions from agriculture) • Consist of CH4 &N2O from aerobic and anaerobic decomposition processes. • Include emissions by cattle, buffaloes, sheep, goats, camels, horses, ducks, chickens, etc. • Emissions grew between 1961 and 2010 from 0.57 to 0.99 GtCO2eq/yr by about 1.1%/yr on an average. • Annual emissions increased by about 10% during 2001-2010 • Growth rate was: • Africa - 2.5%/yr • Asia - 2.3%/yr • Americas - 1.2%/yr • Europe – a decrease of -1.2%/yr From 2000 – 2010 most emissions came from Asia, then Europe, and the Americas.
From 1961 to 2010, global emissions from rice cultivation increasedwith average annual growth rates of 0.4%/yr from 0.37 to 0.52 GtCO2eq/yr. • Largest growth was in Africa (2.7%/yr), followed by Europe and in Asia and the Americas growth rate was much smaller over the same period (0.4–0.7%/yr). • Growth in global emissions has slowed in recent decades, consistent with trends in rice cultivated area. • During 2000–2010, the largest share of emissions (94%) came from developing countries, with Asia being responsible for almost 90% of the total.
Over the period 2001-2011, annual emissions remained fairly stable Burning of Savanna • Consists of Open and Woody Savanna, Open and Closed Shrubland and Grasslands • In 2011, world total annual emissions from burning of savanna were 287 Mt CO2eq • ¬5% of total emissions from agriculture. • Africa contributes 70% of the total emissions Annual average emissions growth rates were negative
Burning of crop residues • Produced by the combustion of crop residues burnt in agricultural fields • In 2011, world total annual emissions from burning of crop residues were 29 Mt CO2 eq, or only 0.5% of total emissions from agriculture • Over the period 2001-2011, total annual emissions increased 15% • Asia was the largest emitter (50%), followed by the Americas (26%), Africa and Europe (both with a 11% share)
Projections for 2030 and 2050 - Agriculture Projection of Agricultural production by region Source: FAO: World Agriculture towards 2030/2050
FOLU emissions • Fluxes resulting directly from anthropogenic FOLU activity are dominated by CO2fluxes, • Primarily emissions due to deforestation • Also uptake due to reforestation/regrowth • Non-CO2greenhouse gas emissions are small in comparison • mainly from peat degradation through drainage and biomass fires • FOLU accounted for about a third of anthropogenic CO2 emissions from 1750 to 2011 and 12% of emissions in 2000 to 2009
Breakdown of mean annual CO2 fluxes from deforestation and forest management in tropical countries (GtCO2/yr) • In 2010, world total annual GHG emissions from net forest conversion • 3,738 Mt CO2 eq. • Represents 70% of total emissions from agriculture sector, and less than half of total emissions from AFOLU. • Emissions in non-Annex I countries represented more than 90% of the total.
FOLU emissions Continental Share Sectoral Contribution
Net Forest Conversion Net Emission/Removals and Forest Net Removals by Decade
Projections for Deforestation • Global net deforestation • Around 13 million ha/year • Net global change in forest area: • -5.2 million ha/year • Both commercial and subsistence agriculture have been reported as main drivers of global deforestation (FRA, 2010, Hosonuma et al 2012) • In Africa and Tropical Asia, this accounts for one third of deforestation. Source: FAO,2015: http://www.fao.org/forestry/fra/85504/en/ • South America: net loss of 4.0 million ha/year • Africa: net loss of 3.4 million ha/year • Asia: net gain of 2.2 million ha/year • Large scale afforestation reported by China • High rates of net loss in many countries in South and Southeast Asia.
Summary • The AFOLU sector is responsible for just under a quarter (~10 – 12 GtCO2eq/yr) of anthropogenic GHG emissions mainly from deforestation and agricultural emissions from livestock, soil and nutrient management. • Annual GHG emissions from agricultural production in 2000 – 2010 were estimated at 5.0 – 5.8 GtCO2eq/yr • Annual GHG flux from land use and land-use change activities accounted for approximately 4.3 – 5.5 GtCO2eq/yr • Since AR4, emissions from the AFOLU sector have remained similar but the share of anthropogenic emissions has decreased to 24% (in 2010), largely due to increases in emissions in the energy sector. • In spite of a large range across global Forestry and Other Land Use (FOLU) flux estimates, most approaches indicate a decline in FOLU carbon dioxide (CO2) emissions over the most recent years, largely due to decreasing deforestation rates and increased afforestation. • Leveraging the mitigation potential in the sector is extremely important in meeting emission reduction targets.
Mitigation Potential of the AFOLU Sector Total mitigation potential for AFOLU sector is estimated to be ~3 to ~7.2 GtCO2-eq./yr in 2030 at 20 and 100 US$/tCO2.-eq., respectively
Regional Differences in Forestry Options, shown as a Proportion of Total Potential