Download
1 / 15
150 likes | 366 Vues
6th ALPS-ADRIA SCIENTIFIC WORKSHOP 30 April - 5 May, 2007 Obervellach, Austria. ENVIRONMENTAL CONSEQUENCES OF SUSTAINABILITY. Quality parameters of wheat. Bi o- ethanol versus bread ?. Pál SZAKÁL 1 – Rezső SCHMIDT 1 – Juraj LESNY 2 – Renátó KALOCSAI 3 – Margit BARKÓCZI 1

E N D
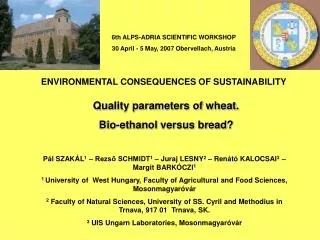
6th ALPS-ADRIA SCIENTIFIC WORKSHOP 30 April - 5 May, 2007 Obervellach, Austria ENVIRONMENTAL CONSEQUENCES OF SUSTAINABILITY Quality parameters of wheat. Bio-ethanol versusbread? Pál SZAKÁL1 – Rezső SCHMIDT1 – Juraj LESNY2 – Renátó KALOCSAI3 – Margit BARKÓCZI1 1 University of West Hungary, Faculty of Agricultural and Food Sciences, Mosonmagyaróvár 2 Faculty of Natural Sciences, University of SS. Cyril and Methodius in Trnava, 917 01 Trnava, SK. 3 UIS Ungarn Laboratories, Mosonmagyaróvár
Decrease of fossil energy carriers Bio-ethanol is a potential replacement of oil and natural gas The increasing importance of high-starch content plants (Wheat, maize) Bio-ethanol, bio polymers, dextrin, starch syrup, D-glucose, etc. EU’s cereal production 285 million tons; Hungary’s cereal production 6 million tons 1 l bio-ethanol appr. 3.1 kg wheat, 2.8 kg maize. (Maize germ)
6 H2O + 6 CO2 C6H12O6 (C6H10O5)n + n H2O nC6H12O6 C6H12O6 2CH3 – CH2 – OH + 2CO2 h amilase CH3 CH3 CH3 C – OH + HO – CH2 – CH3 = CH3 C – O – CH2 – CH3 CH3 CH3 ETBE
Why to use bio-ethanol? • Environmental reasons. Glasshaouse effects, climate change. • Ceasing the dependance on crude oil.
Starch, cellulose, inulin Saccharose containing materials (sugar beet, sorghum, etc.) STARCH Decomposition of starch (cooking with thermo stabile -amylase; Hydrolysis (gluco-amilase) GLUCOSE Fermentation ALCOHOL The production of bio-ethanol
STARCH RAW PROTEIN, GLUTEN Aim: to increase the starch content of wheat for increasing bio- ethanol yield
Material and methods Treatment: manganese carbohydrate Plant: winter wheat Phenological phase: booting Way of application: foliar Soil type: Danube alluvial, Darnózseli, Hungary Experiment: 10 m2 plots, 4 repetitions, randomised block design Doses: 0.05, 0.1, 0.3, 0.5 kgha-1 Mn
The effect of the treatments on the yield TheMn-complexes increased the yield generally, the highest yield was measured at the 0.05 kgha-1 dose, at the higher doses the yield decreased. The lowest yield was measured at 0.5 kgha-1 Mn dose, the value was lower than that of the control. There was not any significant yield increase due to the treatments (LSD5% = 0.57).
Raw protein content The manganese treatments decreased the protein content. We measured the lowest protein content at the Mn-dose of 0.05 kgha-1. The Mn-doses higher than this increased the protein content a little, but it was still lower than the protein content of the control.
Starch content As a result of the treatments the starch content increased and at the 0.1 and 0.3 kgha-1 Mn-saccharose treatment the increase of the starch content was significant (LSD5% = 1.5).
Conclusions • The lower doses of Mn-saccharose increased the yield. • The 0.05 kgha-1 increased the yield the most, but it still was not significant. • At the same time at this dose we measured the lowest (12.63 m%) raw protein content. • Due to the raising Mn-doses the starch content increased, compared to the control. This increase was significant in the case of the Mn-dose of 0.1 kgha-1and 0,3kgha-1.