Download

1 / 29
290 likes | 315 Vues
Exploration of oversize waveguide benefits for EPR spectroscopy. Analysis of linear vs. exponential tapers, inflection point optimization, and resonances in waveguides. Includes comparisons with Ansoft HFSS simulation and fabrication details.

E N D
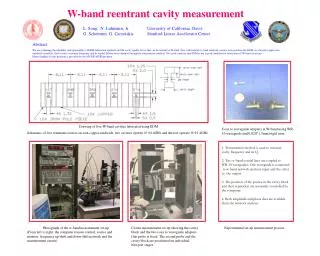
Use of Oversize Waveguide at W-band for EPR Spectroscopy Richard R. Mett Physics and Chemistry Biophysics
Acknowledgements • PI: James S. Hyde (MIT '46) MCW '75 • Jason W. Sidabras (MSOE '03; MU '10?) MCW '03 • Robert Strangeway (MSOE '79; MU '86, '96) MCW '83
Outline • Oversize waveguide is used for reducing insertion loss • Problems with linear taper • Single pass coupling theory: Sporleder & Unger, IEE Electromagnetic waves series 6, (1979). • Comparison of linear and exponential tapers • Why exponential is better and inflection point optimization • Comparison of single-pass theory with Ansoft HFSS (ver. 12.1 Pittsburg, PA) • Two tapers with oversize waveguide in between • Fabrication • Q/A
wavelengths and attenuation lengths for Cu waveguide at 94 GHz use of WR28 can reduce insertion loss by 2(2.60 - 0.523) dB = 4.15 dB
linear taper 76.2 mm 152.4 mm 76.2 mm 76 cm Cu WR28 with brass tapers:
single-passmode coupling theory propagating when k = 0, the modes decouple and evanescent line integral around waveguide cross section of derivatives of T1 T2 normalized vector potential
basic conclusions about single-pass theory • for a flared waveguide transition • the coupled system is symmetric for modes propagating in the same direction and antisymmetric for opposite directions • || = 0 for any two modes with corresponding indices that differ by an odd integer • the coupled system can be solved numerically using NDSolve in Mathematica (ver. 7 Wolfram Champaign, IL) • significant coupling occurs in the evanescent region • the evanescent part of the coupled mode cannot be neglected • higher mode indices have cutoff closer to the large end of the taper • these modes have less propagation space and therefore couple less to the main mode
coupling to TE10 main mode in linear taper TM12 and TE12 are transmitted and TE10 is reflected: 92 GHz 94 GHz 96 GHz
coupled wave behavior • increasing || produces an increase in wave amplitude. • decreasing || produces a decrease in wave amplitude. • || is a maximum at maximum flare (point of inflection)
coupling to TE10 main mode in exponential taper inflection point d (mm): 2 (red), 5 (orange), 8 (green), 11 (blue) and 14 (purple) and f = 94 GHz
optimization of inflection point • optimum d is a compromise between competing effects: • R and T vary with d and less strongly with f • increasing distance between d and the end increases interference and decreases the wave amplitude exiting the taper • however, R and T modes exit opposite ends of the taper • wave interference is stronger for the reflected mode than higher order transmitted modes • inflection point tends to be optimum near the small end of the taper because only a few wavelengths are required to null the reflection coefficient. • is a good value • dimension picked for fabrication: • value obtained by scaling opposite waveguide cross sectional areas
comparison of single-pass theory to Ansoft HFSS • differences are caused by: • - in single-pass theory, the modes propagate in only one direction • - in single pass theory, the higher order modes are not coupled to each other • - single pass theory neglects terms of second order in dz: • This is satisfied in the exponential taper but not at the edges of the linear taper.
resonances in oversize waveguide • higher order coupled modes reflect from the cutoff locations in the taper • if the phase between such a reflected mode on each side of the taper is constructive, the mode amplitude will grow • at such frequencies, the oversize waveguide acts like a large cavity resonator for the higher order modes • this robs power from the main mode and causes comb-like dips in the transmission coefficient (see linear taper HFSS simulations) • such dips can be quantified: • where • linear taper: exponential taper: • if the coupling strength to higher order modes is sufficiently low, no resonances occur
exponential taper fabrication • Mathematica was used to create a list of edge data points in three dimensions and this was exported as a data file • this data was imported into Autodesk Inventor 2010 where the "loft" function was used to create a smooth body • this mandrel was then exported as a "step" file • the step file was imported into Ansoft HFSS to create the vacuum region of the taper • this was divided into 20 sub-regions to obtain proper meshing • the step file was also emailed to A. J. Tuck (Brookfield, CT) for fabrication by electroforming
Research Strategy • The finite element program Ansoft HFSS (Pittsburgh, PA) is used to test new ideas and develop insight. • Analytic models are developed and then used to make predictions with help from Mathematica (Wolfram, Champaign, IL). • Predictions are tested against the finite element code. • Insights come from this, which lead to inventions. • Autodesk Inventor is used to design the mechanical structures in 3D. • Structures are built, tested and ultimately used.
What is EPR? Unpaired electrons magnetic moment precession in static magnetic field Radio frequency (rf) magnetic field with f = fprecess electrons absorb energy tilt angle changes wrt static field • Change of tilt change in the magnetization of the material • This is Electron Paramagnetic Resonance (EPR) • Same principle certain nuclei • Nuclear Magnetic Resonance (NMR) and MRI
How is EPR observed? • Unpaired electrons interact with magnetic moments of • nearby nuclei • other unpaired electrons • Interaction rf energy absorption • Sweep static magnetic field EPR spectrum unpaired electron nitroxide EPR spectra nitroxide spin label
What is measured? • During setup, the resonator is critically coupled to the transmission line. • Critical coupling is when the resonator is balanced to absorb all incoming microwave power. • As the static magnetic field is swept, the sample absorbs microwave power, creating an imbalance. • The sample detunes the resonator around resonance. • The detuning causes reflections, frequency and • phase shifts that are received by the spectrometer. • Both real and imaginary shifts are present and • can be collected.
What can EPR be used for? • Determining the molecular structure of very complex molecules including proteins. • Measuring complex chemical reactions in biological organisms • oxygen transport, photosynthesis, tumor growth, muscle contraction, and vision. • EPR imaging • Investigating survival of stem cells used to rebuild heart muscle. This has led to techniques that improve outcomes. • Tumor growth • Underlying reason: EPR spectrum contains information about the neighborhood of the electron.