Download
1 / 25
250 likes | 381 Vues
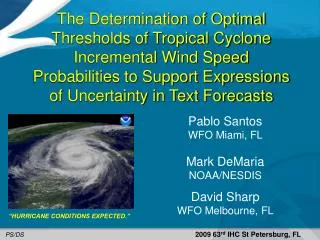
The Determination of Optimal Thresholds of Tropical Cyclone Incremental Wind Speed Probabilities to Support Expressions of Uncertainty in Text Forecasts. Pablo Santos WFO Miami, FL Mark DeMaria NOAA/NESDIS David Sharp WFO Melbourne, FL. “HURRICANE CONDITIONS EXPECTED.”.

E N D
The Determination of Optimal Thresholds of Tropical Cyclone Incremental Wind Speed Probabilities to Support Expressions of Uncertainty in Text Forecasts Pablo Santos WFO Miami, FL Mark DeMaria NOAA/NESDIS David Sharp WFO Melbourne, FL “HURRICANE CONDITIONS EXPECTED.” 2009 63rd IHC St Petersburg, FL PS/DS
Probability Definitions (A Quick Review) • Cumulative – The probability of sustained winds reaching or exceeding the specified wind speed threshold between the 00 hour forecast and a specified forecast hour. • Available in D2D and within the PWSAT# text product. • Individual (Interval) – The probability of sustained winds reaching or exceeding the specified wind speed threshold beginning during an individual 12 hour forecast period ending at the specified forecast hour (e.g., period of onset). • Not available in D2D, but within the PWSAT# text product. • Incremental –The probability of sustained winds reaching or exceeding the specified threshold during the 12 hour forecast period ending at the specified forecast hour. • Now available in D2D (across the SBN), but not within the PWSAT#. • These are the probabilities referenced throughout this presentation.
Proposed WFO Use(Item 42-05 from NOAA Hurricane Conference, 2005) • During potential high impact weather events such as tropical cyclones (TC), users not only demand our ‘best forecast’, but also require a corresponding expression of uncertainty for decision-making purposes. • Therefore, we developed a methodology that uses TC Wind Speed Probabilities to elevate the utility of official text products: • By including situational expressions of uncertainty within the Zone Forecast Product (ZFP) and the Coastal Waters Forecast (CWF) that allows the responsible downscaling of TPC’s forecast in space and time. • For WFOs, this effort crosses a major threshold for incorporating probabilistic data (other than PoP) within official National Weather Service forecast products.
Baseline Phraseology (The Nine Expressions of Uncertainty) • The *phrases are equivalent to imminent or ongoing conditions as • reflected in the 00-12 hour period simultaneously by the hazard, wind, and • probability grids. • The word EXPECTED is used in situations mainly during the Warning period, but is • also selectively used in the Watch period (e.g., Day 1 & 2, or out to period 4). • The word POSSIBLE is used during the extended period (e.g., Day 3 - 5), but is also • used in specific situations within Watch/Warning period. • Also, certain situations require compound phrases (e.g., when there is a Tropical • Storm Warning with a Hurricane Watch).
A Second Algorithm Example Advisory Time: 20040813_1500 (0-12 Hours – First Period) CHARLEY (ZFP) * Punta Gorda Hurricane Charley (ZFP)
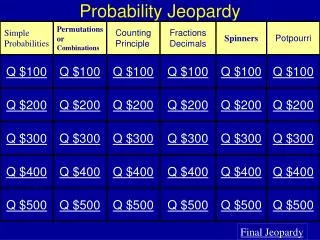
Selection of Optimal Probability Thresholds • NHC verification program evaluates gridded products • Special procedure for WFO application • Sample: • 2004-2008 cases with U.S. hurricane warnings • All probability runs starting 3 days before 1st warning • 2008 MC model re-run for 401 forecast cases • Evaluate probabilities at 343 U.S. coastal “breakpoints” • Use Threat Score or ROC diagrams to select optimal probability thresholds • Emphasis on 12 h incremental probabilities • Results for 34 and 64 kt probabilities • NHC best track used to determine points with observed hurricane winds
Conversion of Probabilities into Yes-No Forecast • Pick probability threshold (Pt) • If P ≥ Pt, forecast YES • If P < Pt, forecast NO • Best choice of Pt depends on particular application • Use appropriate validation metric to select Pt objectively • Metrics determined from contingency table
Observed Yes No Yes Forecast No a b c d Contingency Table for Validation of Yes-No Forecasts Threat Score (TS) = a/(a + b + c) Hit Rate (HR) = a/(a + c) False Alarm Rate (FR) = b/(b + d)
Pt Optimization Procedures • Threat Score • Threat Score useful for low probability events since it does not include No-No cases • TS ranges from 0 to 1 (1 is best) • Pick Pt that maximizes TS • Hit Rate/False Alarm Rate • Plot HR vs. FR in 2-D plane for range of Pt • Relative Operating Characteristic (ROC) diagram • Pick Pt for point closest to upper left corner in ROC diagram • Upper left corner has Hit Rate=1, False Alarm Rate=0
Optimal 34 and 64 kt Probability Thresholds based on Threat Score and ROC Diagram
Regional Stratification • Region 1 • Brownsville, TX to Mobile, AL • Region 2 • Mobile, AL to GA/SC Border • Includes all Florida breakpoints • Region 3 • GA/SC Border to Eastport, ME • Estimate optimal probabilities using Threat Score • ROC score probabilities too low
On-going Work • Test additional validation metrics for optimal thresholds • Modify Probabilistic thresholds used prior to the 2009 season. • Conduct validation for inland points.
Current & Future Work • Conduct experiment during 2009 season • All NWS SR Coastal offices will be part of it. Perhaps ER Offices too. • This will affect Public as well as Marine Forecast including the official Zone as well as the point and click versions. • Consider other applications (e.g., Point Forecast Matrices, etc.)
Objectives • To better understand the shortcomings of WFO scale deterministic-only wind speed forecasts during high impact weather events. • To gain a greater appreciation for the value of probabilistic wind speed information and how incremental probabilities can be used to improve certain text products. • To present validation of the incremental wind speed probability thresholds used in the enhanced public and marine text forecast products.
A Second Algorithm Example Advisory Time: 20040813_1500 (0-12 Hours – First Period) CHARLEY (ZFP) * Naples Morning Update Hurricane Charley (ZFP)
A Second Algorithm Example Advisory Time: 20040813_1500 (0-12 Hours – First Period) CHARLEY (ZFP) * Naples Morning Update Hurricane Charley (ZFP)
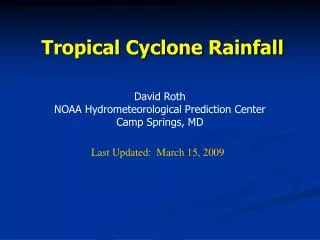
Threat Score vs. Probability Threshold 24-36 hr Incremental 64 kt Probabilities Optimal Probability Threshold = 19%
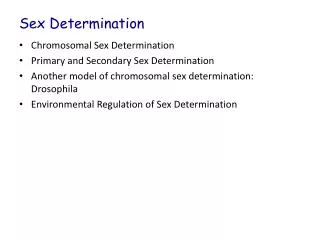
ROC Diagram for 24-36 hr Incremental 64 kt Probabilities Optimal Probability Threshold Pt = 4% Pt=1% Pt=0% Pt=100%