Exploring Hypothesis Testing: Two-Sample Z-Test and T-Test in Biostatistics
160 likes | 292 Vues
This lecture provides an in-depth analysis of hypothesis testing using examples from Fisher's Iris data. It demonstrates how to compare two populations through a two-sample z-test and a t-test. The focus includes setting up null and alternative hypotheses, calculating test statistics, and determining significance levels. The lecture specifically examines the Sepal Length of Setosa and Versicolor, and the Petal Length of Versicolor and Virginica, emphasizing assumptions of normally distributed data and known versus unknown variances.

Exploring Hypothesis Testing: Two-Sample Z-Test and T-Test in Biostatistics
E N D
Presentation Transcript
Biostatistics-Lecture 4More about hypothesis testing Ruibin Xi Peking University School of Mathematical Sciences
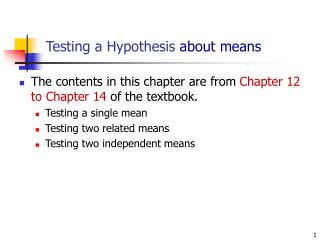
Comparing two populations—two sample z-test • Consider Fisher’s Iris data • Interested to see if Sepal.Length of Setosaand versicolor are the same • Let μ1 and μ2 be their Sepal.Lengths, respectively • State the hypothesis • H0: μ1= μ2 VS H1: μ1≠μ2 • H0: μ1 2 = μ1 -μ2=0 VS H1: μ1 2≠ 0
Comparing two populations—two sample z-test • Choose the appropriate test • First Assume that the data from both groups are normally distributed with known variance (σ1= 0.35, σ2=0.38)
Comparing two populations—two sample z-test • Choose the appropriate test • First Assume that the data from both groups are normally distributed with known variance (sd1= 0.35, sd2=0.38)
Comparing two populations—two sample z-test • Choose the appropriate test • First Assume that the data from both groups are normally distributed with known variance (sd1= 0.35, sd2=0.38)
Comparing two populations—two sample z-test • Choose the appropriate test • First Assume that the data from both groups are normally distributed with known variance (σ1= 0.35, σ2=0.38) • We have • Significance Level α=0.01
Comparing two populations—two sample z-test • Calculate the test statistics • z = -10.52 • |z| > 2.58, reject the NULL • One-sided test: • H0: μ1 = μ2 VS H1: μ1>μ2 • H0: μ1 = μ2 VS H1: μ1<μ2
Comparing two populations—two sample t-test • Consider Fisher’s Iris data • Interested to see if Petal.Length of versicolor and virginica are the same • Let μ1 and μ2 be their Petal.Length, respectively • State the hypothesis • H0: μ1 = μ2 VS H1: μ1 ≠ μ2 • H0: μ1 2 = μ1 -μ2 =0 VS H1: μ1 2 ≠ 0
Comparing two populations—two sample t-test • Choose the appropriate test • First Assume that the data from both groups are normally distributed with unknown but equal variance
Comparing two populations—two sample t-test • Choose the appropriate test • First Assume that the data from both groups are normally distributed with unknown but equal variance
Comparing two populations—two sample t-test • Choose the appropriate test • First Assume that the data from both groups are normally distributed with unknown but equal variance
Comparing two populations—two sample t-test • Choose the appropriate test • First Assume that the data from both groups are normally distributed with unknown but equal variance • F-test for equal variance gives p-value 0.26 • has tn1+n2-2
Comparing two populations—two sample t-test • Significance level 0.01 • Calculate the test statistic • t = -12.6 • Reject the Null (|t| > 2.63)
Comparing two populations—two sample t-test (unequal variance) • Consider Fisher’s Iris data • Interested to see if Sepal.Length of Setosa and versicolor are the same • Let μ1 and μ2 be their Petal.Length, respectively • State the hypothesis • H0: μ1 = μ2 VS H1: μ1 ≠ μ2 • H0: μ1 2 = μ1 -μ2 =0 VS H1: μ1 2 ≠ 0
Comparing two populations—two sample t-test • Choose the appropriate test • First Assume that the data from both groups are normally distributed • F-test of equal variance gives pvalue=0.009 (s1=0.35,s2=0.51) • Test statistic This distribution is NOT exact
Comparing two populations—two sample t-test • Significance level 0.01 • Calculate the test statistic • t = -10.5 • Reject the Null (|t| > 2.68)