Download
1 / 35
350 likes | 490 Vues
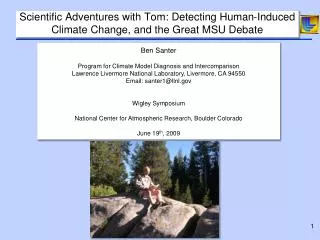
Scientific Adventures with Tom: Detecting Human-Induced Climate Change, and the Great MSU Debate. Ben Santer Program for Climate Model Diagnosis and Intercomparison Lawrence Livermore National Laboratory, Livermore, CA 94550 Email: santer1@llnl.gov Wigley Symposium

E N D
Scientific Adventures with Tom: Detecting Human-Induced Climate Change, and the Great MSU Debate Ben Santer Program for Climate Model Diagnosis and Intercomparison Lawrence Livermore National Laboratory, Livermore, CA 94550 Email: santer1@llnl.gov Wigley Symposium National Center for Atmospheric Research, Boulder Colorado June 19th, 2009
Structure of talk • What is climate change detection and attribution? • A brief history of fingerprint research • Fingerprinting examples • Inconvenient observations • Does fingerprinting have a future? • Conclusions
Detection and attribution defined • Detection of climate change • The process of showing that an observed change is highly unusual in a statistical sense • Attribution of climate change • The process of establishing cause and effect relationships
Detection and attribution research has made important contributions to the conclusions of IPCC assessments “The balance of evidence suggests a discernible human influence on global climate” “Most of the observed increase in globally averaged temperatures since the mid-20th century is very likely* due to the observed increase in anthropogenic greenhouse gas concentrations” “There is new and stronger evidence that most of the warming observed over the last 50 years is attributable to human activities”
Structure of talk • What is climate change detection and attribution? • A brief history of fingerprint research • Fingerprinting examples • Inconvenient observations • Does fingerprinting have a future? • Conclusions
What is “climate fingerprinting”? • Strategy: Search for a computer model-predicted pattern of climate change (the “fingerprint”) in observed climate records • Assumption: Each factor that influences climate has a unique signature in climate records • Method: Standard signal processing techniques • Advantage: Fingerprinting allows researchers to make rigorous tests of competing hypotheses regarding the causes of recent climate change
Key scientific questions addressed in detection and attribution (“D&A”) studies EARLY WORK (1979 to mid-1990s) • Can we use climate model data to identify promising “fingerprints” of human effects on climate? • What are the relative merits of different “fingerprint” detection methods? LATER WORK (mid-1990s to present) • Can we apply D&A methods in the real world, and successfully identify a human-caused “fingerprint” in observed climate records? • Can we move beyond “temperature only” D&A studies? • Is the climate system telling us a physically- and internally-consistent story?
A brief history of D&A research: Some important milestones Publication of first paper on the theory of optimal detection First work on S/N ratios for a greenhouse-gas signal First application of optimal detection method to problem of detecting human influences on climate 1979 1980 1981 1982 1983 1984 1985 1986 Application of pattern correlations and multi-variable methods to D&A problem Publication of IPCC First Assessment Report 1994 1987 1988 1989 1990 1991 1992 1993 Introduction of space-frequency D&A approach; Detection of GS fingerprint in SAT Publication of IPCC SAR; Fingerprinting with atmospheric temperature and SAT Introduction of “multi-pattern” fingerprinting First use of Bayesian methods in D&A studies Recognition that “Optimal detection is regression”; First use of space-time D&A methods Publication of IPCC TAR; Fingerprinting with ocean heat content 1995 1996 1997 1998 1999 2000 2001 2002 Fingerprinting with tropopause height, sea-level pressure, MSU T4 and T2 temperatures First assessment of “fractional attributable risk” for an extreme event Fingerprinting with continental runoff; CCSP Report 1.1 resolves MSU problem Publication of IPCC FAR; Fingerprinting with zonal-mean rainfall, water vapor, and surface specific humidity All sins of omission or commission are unambiguously attributable to Ben Santer 2003 2004 2005 2006 2007 2008
A brief history of D&A research: Some important milestones Publication of first paper on the theory of optimal detection First work on S/N ratios for a greenhouse-gas signal First application of optimal detection method to problem of detecting human influences on climate 1979 1980 1981 1982 1983 1984 1985 1986 Application of pattern correlations and multi-variable methods to D&A problem Publication of IPCC First Assessment Report 1994 1987 1988 1989 1990 1991 1992 1993 Introduction of space-frequency D&A approach; Detection of GS fingerprint in SAT Publication of IPCC SAR; Fingerprinting with atmospheric temperature and SAT Introduction of “multi-pattern” fingerprinting First use of Bayesian methods in D&A studies Recognition that “Optimal detection is regression”; First use of space-time D&A methods Publication of IPCC TAR; Fingerprinting with ocean heat content 1995 1996 1997 1998 1999 2000 2001 2002 Fingerprinting with tropopause height, sea-level pressure, MSU T4 and T2 temperatures First assessment of “fractional attributable risk” for an extreme event Fingerprinting with continental runoff; CCSP Report 1.1 resolves MSU problem Publication of IPCC FAR; Fingerprinting with zonal-mean rainfall, water vapor, and surface specific humidity All sins of omission or commission are unambiguously attributable to Ben Santer 2003 2004 2005 2006 2007 2008
D&A in the early 1980s: Defining and bounding the problem (Wigley and Jones, Nature, 1981) • The best climate parameters to monitor are those with the highest signal-to-noise ratio (not necessarily those with highest signal!) • Information in the spatial and seasonal patterns of climate change may help to distinguish between a GHG signal and natural variability • Important to study other climate variables (not just surface temperature) • Noise reduction is helpful in D&A work (e.g., by spatial averaging, time averaging, and removal of noise associated with ENSO variability) • “The effects of CO2 may not be detectable until around the turn of the century. By this time, atmospheric CO2 concentration will probably have become sufficiently high… that a climatic change significantly larger than any which has occurred in the past century could be unavoidable.”
D&A in 1990: The view from the first IPCC Scientific Assessment Report • “The fact that we have not yet detected the enhanced greenhouse effect leads to the question: When is this likely to occur? …Detection is not a simple yes/no issue. Rather, it involves the gradual accumulation of evidence in support of model predictions, which, in parallel with improvements in the models themselves, will increase our confidence in them and progressively narrow the uncertainties…” • “…the time frame for detection is likely to be of order a decade or more. In order to detect the enhanced greenhouse effect within this time frame, it is essential to continue the development of models, and to ensure that existing observing systems for both climate variables and potential climate forcing factors be maintained or improved.” Wigley and Barnett, “Detection of the greenhouse effect in the observations”, Chapter 8 of IPCC First Assessment Report (1990)
Structure of talk • What is climate change detection and attribution? • A brief history of fingerprint research • Fingerprinting examples • Inconvenient observations • Does fingerprinting have a future? • Conclusions
Different factors that influence climate have different “fingerprints” 10 10 28 28 25 25 24 24 50 50 20 20 Pressure (hPa) Height (km) 1. Solar 2. Volcanoes 100 100 16 16 12 12 200 200 300 300 8 8 500 500 4 4 700 700 90N 60N 30N Eq 30S 60S 90S 90N 60N 30N Eq 30S 60S 90S 10 10 28 28 25 25 24 24 3. Well-mixed greenhouse gases 50 50 20 20 4. Ozone Pressure (hPa) Height (km) 100 100 16 16 12 12 200 200 300 300 8 8 500 500 4 4 700 700 90N 60N 30N Eq 30S 60S 90S 90N 60N 30N Eq 30S 60S 90S 10 28 25 24 50 20 5. Sulfate aerosol particles Height (km) 100 16 Pressure (hPa) 12 200 300 8 500 4 700 90N 60N 30N Eq 30S 60S 90S -1 -0.6 -0.2 0.2 0.6 1 Santeret al., CCSP Report (2006) °C/century -1.2 -0.8 -0.4 0 0.4 0.8 1.2
50 18 100 14 200 10 300 6 500 2 850 60N 45N 30N 15N 0 15S 30S 45S 60S “Fingerprinting” with temperature changes in Earth’s atmosphere Model Changes: CO2 + Sulfate Aerosols + Stratospheric Ozone 50 18 100 14 Pressure (hPa) Height (km) 200 10 300 6 500 2 850 60N 45N 30N 15N 0 15S 30S 45S 60S Observed Changes Pressure (hPa) Height (km) Temperature changes in oC -1.5 -0.9 -0.3 0.3 0.9 1.5 -1.8 -1.2 -0.6 0 0.6 1.2 1.8 Santeret al., Nature (1996)
The climate system is telling us a physically-consistent story. We have identified human fingerprints in… TEMPERATURE FIELDS • Global-scale surface temperatures • Regional-scale surface temperatures • Vertical profiles of atmospheric temperature • Global ocean heat content • MSU stratospheric and tropospheric temperatures • The height of the tropopause • Vertical structure of upper-ocean temperatures • SSTs in hurricane formation regions • Arctic and Antarctic temperatures
We’ve moved beyond “temperature only” fingerprint detection studies… ATMOSPHERIC CIRCULATION, SEA-ICE, AND THE HYDROLOGICAL CYCLE • Sea-level pressure • Continental-scale runoff • Atmospheric water vapor over oceans • Surface specific humidity • Zonal-mean precipitation • Hydrologically-relevant climate variables in the western U.S. • Arctic sea-ice extent
Structure of talk • What is climate change detection and attribution? • A brief history of fingerprint research • Fingerprinting examples • Inconvenient observations • Does fingerprinting have a future? • Conclusions
No history of detection and attribution work would be complete without discussion of the “great MSU debate” “Inconvenient observations” – the apparent lack of tropospheric warming in satellite data “…satellite measurements over 35 years show no significant warming in the lower atmosphere, which is an essential part of the global-warming theory.” James Schlesinger (former U.S. Secretary of Energy, Secretary of Defense, and Director of the CIA), “Cold Facts on Global Warming,” L.A. Times, January 22, 2004
Using microwave sounders to measure atmospheric temperature from space • Higher temperatures = more microwave emissions from oxygen molecules • By choosing different microwave frequencies, different layers in the atmosphere can be measured • Much of the scientific focus has been on measurements of the temperature of the lowest 7–8 km of the atmosphere Figure and text courtesy of Carl Mears, RSS
Which groups have been involved in constructing “Climate Data Records” from MSU information? • University of Alabama at Huntsville (UAH) • John Christy and Roy Spencer • Remote Sensing Systems (RSS) • Frank Wentz and Carl Mears • University of Maryland (UMd) • Konstantin Vinnikov, Norm Grody • NOAA National Environmental Satellite, Data, and Information Service • Cheng-ZhiZou, Mitch Goldberg, et al.
The UAH satellite dataset implied that the troposphere cooled as the tropical surface warmed
The RSS satellite data showed that the troposphere warmed by more than the surface
What factors contribute to these differences? • Local measurement time for each satellite drifts due to orbital drift • This leads to drifts in the sampling of the Earth’s daily temperature cycle • These drifts need to be removed, or they can affect long-term trends 24 22 NOAA-8 NOAA-6 NOAA-10 NOAA-12 20 Ascending LECT (Hrs.) 18 NOAA-6 16 TIROS-N 14 NOAA-7 NOAA-9 NOAA-11 NOAA-14 12 1980 1985 1990 1995 2000 Year Figure and text courtesy of Carl Mears, RSS
Three papers in Science partially resolved the “great MSU debate” An early satellite-based analysis of the temperature of the tropical troposphere has a spurious cooling trend Weather balloon estimates of the temperature of the tropical troposphere also contain a spurious cooling trend When errors in the satellite and weather balloon data are accounted for, both models and observations show warming of the tropical troposphere relative to the surface
Resolution (Executive Summaryof U.S. Climate Change Science Program Report, May 2006)
Resolution (Executive Summaryof U.S. Climate Change Science Program Report, May 2006)
A brief history of MSU research: Some important milestones Theory of microwave absorption by oxygen by J.H. van Vleck J.I.F. King proposesusing satellites to derive atmospheric temperature by measurement of atmospheric thermal emissions M.L. Meeks suggests use of microwave emissions from oxygen for monitoring atmospheric temperature Meeks and Lilley develop basic concept for use of microwave emissions from oxygen for monitoring atmospheric temperature 1947 1956 1961 1963 1978 First complete year of MSU-based temperature measurements Christy and Spencer outline a method for retrieving lower tropospheric temperature Publication of first MSU paper by Spencer and Christy in Science 1994 1979 1990 1991 1992 1993 Hurrell and Trenberthidentify multiple problems with UAH MSU records Wentz and Schabelidentify “falling satellite” effect missed by UAH group Christy et al. discover two errors which compensate for the “falling satellite” effect 1995 1996 1997 1998 1999 2000 2001 2002 Santer et al. perform “fingerprinting” with MSU T4 and T2; Vinnikov and Grodyproduce T2 record Fu et al. quantify contribution of cooling stratosphere to MSU T2 U.S. Climate Change Science Program Report 1.1 partially resolves MSU problem Mears and Wentz, Sherwood et al., and Santer et al. papers published in Science Douglasset al. claim existence of significant model- versus-OBS discrepancy Rebuttal of Douglass et al. paper by Santer et al. All sins of omission or commission are unambiguously attributable to Ben Santer 2003 2004 2005 2006 2007 2008
A brief history of MSU research: Some important milestones Theory of microwave absorption by oxygen by J.H. van Vleck J.I.F. King proposesusing satellites to derive atmospheric temperature by measurement of atmospheric thermal emissions M.L. Meeks suggests use of microwave emissions from oxygen for monitoring atmospheric temperature Meeks and Lilley develop basic concept for use of microwave emissions from oxygen for monitoring atmospheric temperature 1947 1956 1961 1963 1978 First complete year of MSU-based temperature measurements Christy and Spencer outline a method for retrieving lower tropospheric temperature Publication of first MSU paper by Spencer and Christy in Science 1994 1979 1990 1991 1992 1993 Hurrell and Trenberthidentify multiple problems with UAH MSU records Wentz and Schabelidentify “falling satellite” effect missed by UAH group Christy et al. discover two errors which compensate for the “falling satellite” effect 1995 1996 1997 1998 1999 2000 2001 2002 Santer et al. perform “fingerprinting” with MSU T4 and T2; Vinnikov and Grodyproduce T2 record Fu et al. quantify contribution of cooling stratosphere to MSU T2 U.S. Climate Change Science Program Report 1.1 partially resolves MSU problem Mears and Wentz, Sherwood et al., and Santer et al. papers published in Science IPCC FAR published; Douglasset al. claim significant model/ OBS discrepancy Rebuttal of Douglass et al. paper All sins of omission or commission are unambiguously attributable to Ben Santer 2003 2004 2005 2006 2007 2008
Structure of talk • What is climate change detection and attribution? • A brief history of fingerprint research • Fingerprinting examples • Inconvenient observations • Does fingerprinting have a future? • Conclusions
Looking towards the future • In a post AR4 world, is the science “done and dusted”? • What will the role of detection and attribution research be in AR5?
Key scientific issues for future detection and attribution (“D&A”) studies • Most fingerprint work has focused on global-scale changes in individual, “primary” climate variables • Can we identify anthropogenic effects on climate at continental to regional scales? • Can we identify anthropogenic fingerprints in variables of direct relevance to climate-change impacts? (e.g., timing of stream flow, snowpack depth) • Can we attribute shifts in the distributions of plant and animal species to human influences? (the “double attribution” problem) • Can a “multi-variable” fingerprint help us to identify human effects on climate?
Key scientific issues for future detection and attribution (“D&A”) studies • We now live in a multi-model world, yet most D&A studies to date have been performed with individual models • Can we show that D&A results are robust to current uncertainties in model estimates of the searched-for fingerprint and the noise of natural variability?
Key scientific issues for future detection and attribution (“D&A”) studies • We cannot confidently attribute any specific extreme event to human-induced climate change • But can we make informed scientific statements about the influence of human activities on the likelihood of extreme events? (the “operational attribution” issue)
Structure of talk • What is climate change detection and attribution? • A brief history of fingerprint research • Fingerprinting examples • Inconvenient observations • Does fingerprinting have a future? • Conclusions
Conclusions • MSU-based estimates of tropospheric temperature change are not “inconvenient observations” • We have identified human “fingerprints” in a number of different aspects of the climate system • We have moved beyond “temperature only” D&A • Criticisms leveled at IPCC Second Assessment Report (“you are only looking at surface temperature changes”) are no longer valid • The climate system is telling us a physically- and internally-consistent story: Natural causes alone cannot explain the observed climate changes • Tom Wigley has played a major role in telling both the MSU and fingerprint stories