Download
1 / 28
280 likes | 449 Vues
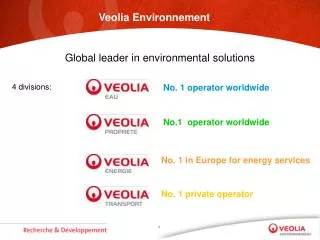
No. 1 operator worldwide. No.1 operator worldwide. No. 1 in Europe for energy services. No. 1 private operator. Veolia Environnement. Global leader in environmental solutions. 4 divisions:. Revenue per division. Veolia Environnement. Key figures: 157 years of serving the environment

E N D
No. 1 operator worldwide No.1 operator worldwide No. 1 in Europe for energy services No. 1 private operator Veolia Environnement Global leader in environmental solutions 4 divisions:
Veolia Environnement • Key figures: • 157 years of serving the environment • 2009 revenue: €34.6 billion • Operations in 72 countries aroundthe world • 336,000 employees worldwide • €140 million invested in research • 450 researchers with450 field developers
Dr Jean-Christophe Schrotter Membrane R&D Director Development of advanced solutions to meet future water challenges
Advanced solutions : The outline • Background • Water treatment cycle • Solutions to solve water scarcity issues • Where are we now ? • examples of current water treatment plants • What to expect for the future ? • examples of revolutionary processes
Water treatment cycle Reuse water Reuse treatment Irrigation surface Drinking water Drinking water plant ground Wastewater treatment Common use Other Industry desalination Brackish or Sawater
Water Reuse and Desalination Growth (m3/d) Ref : Global water market 2008, GWI
Desalination and Waste water reuse Plants • Veolia references • More than 150 reuse plants (>3.2M m3/d) • Hundred desal plants (10M m3/d). More than 15% of the world’s desal installed capacity.
Membranes : a Great Evolution ! Membrane: key enabling technology for desalination, reuse treatment process that needs to deliver higher quality product waters from lower quality feed waters.
Microscopic view of a membrane surface Membrane pore diameter 0.2 m Cryptosporidium : 3 à 6 m
Pollutant removal by membrane processes Influenza Virus 0,1 m Giardia Lamblia andCryptosporidium 3 à 6 m water 0,0002 m Pesticides 0,007 m Pseudomonas Diminuta 0,28 m . Sodium 0,00037 m Strepto 1 m Reverse Osmosis Nano-filtration Ultra-filtration Micro-filtration 0,0001 m 0,001 m 0,01 m 0,1 m 1m 10 m 100 m Membrane pores diameters Increasing energy demand
Advanced solutions : The outline • Background • Water treatment cycle • Solutions to solve water scarcity issues • Where are we now ? • examples of current water treatment plants • What to expect for the future ? • examples of revolutionary processes
Gold Coast Desalination Plant 125 000 m3/din operation since 2009
Overall Plant train 13 ppm as Fe2(SO4)3 Sodium Bisulphite Shock Chlorination 0.1 ppm polymer NaOH (pH = 10) 1.7 ppm antiscalant 2 ppm antiscalant Flocculation / Dual Media Filters Inlet Pumping Station Cartridge Filters RO 1 RO 2 – stage 1 Booster Pumps 1st RO Pass HP Pumps 2nd Pass RO HP Pumps RO 2 – stage 2 Lime Water & CO2 FinalDisinfection OffshorePipe Drinking Water storage Post Treatment Network
Western Corridor Water treatment Project • 235,000 m3/d for industrial reuse (Power station, steel and paper plants) • Household irrigation and indirect potable reuse being considered • Treated water quality • <250 mg/l TDS • <1.2 mg/l N total • <0.15 mg/l P total
Treated Water Quality - Micropollutants About 200 parameters twice a week
Micropolluant removal with MF/RO/H2O2+UV by Samer Adham –MWH- AWA membranes Conference II, 21-23 Feb 2007, Melbourne Australia). concentrations in ng/L at different steps molecules Nature detection limit ng/L feed RO post RO post UV+peroxyde hydrocodone analgesic 1 80 <1 <1 Trimethoprime antibiotic 1 384 2,95 <1 acetaminophene analgesic 10 <10 <10 <10 Caffeine - 10 <10 <10 <10 Erythromycine antibiotic 1 298 <1 <1 Sulfamethoxazole antibiotic 1 892 2,9 <1 Fluoxethine antidepressant 1 33 <1 <1 Pentoxifylline vasodilator 1 12 <1 <1 Meprobamate anxiolytic 1 292 1,5 <1 Dilantine antiepileptic 1 144 <1 <1 TCEP chelatant 10 272 <10 <10 Carbamazepine antiepileptic 1 279 2,4 <1 DEET pesticide 5 293 <5 <5 Atrazine pesticide 1 1 <1 <1 Diazepame anxiolytic 1 1 <1 <1 Oxybenzone pesticide 5 21 <5 <5 Estriol steroid 5 14 <5 <5 Ethinylestradiol steroid 1 <1 <1 <1 Estrone steroid 1 101 <1 <1 Estradiol steroid 1 18 <1 <1 Testoterone steroid 1 <1 <1 <1 Progesterone steroid 1 <1 <1 <1 Androstenedione steroid 1 5 <1 <1 Iopromide antineoplastic 1 632 1,4 <1 Naproxene painkiller 1 255 1,2 <1 Ibuprofene painkiller 1 79 <1 <1 diclofenac painkiller 1 89 <1 <1 Triclosan preservative 1 324 3,4 <1 Gemfibrozil 1 1022 1,3 <1 antihyperlipidemic atherosclerosis.
Simplicity • No reaction • No by-products • “Limited chemicals” • Product Quality • Selective removal of Pollutants according to needs Flexibility Modular design Advantages Membrane for desal and Reuse application Disadvantages Product quantity Fouling intensive energetically and operationally Concentrate Waste treatment
Membrane treatment plant Water treatment Electricity Electricity, chemicals Electricity, chemicals Electricity, heatchemicals, spare parts Electricity, chemicals Electricity Raw water in water resource Intake pumping Clarification Filtration Membrane processes Disinfection Distribution Potable water delivered to users Liquid effluents Electricity Liquid effluents Sludge treatment Liquid effluents Complex process train are currently used to minimize membrane fouling ►Chemically, energetically and operationally intensive
Advanced solutions : The outline • Background • Water treatment cycle • Solutions to solve water scarcity issues • Where are we now ? • examples of current water treatment plants • What to expect for the future ? • examples of revolutionary processes
Unique Selling Points http://nobelprize.org/nobel_prizes/ chemistry/laureates/2003/chemanim1.mpg Absolute Pure Water ~ 100% ( ~ 99.999995% salt rejection, being approx. 10.000 times better than today’s best reverse osmosis membranes have ever shown) Reduced energy costs by ~ 80% ( ~ Estimated 5 x energy reduction; or 5 x increase in water flux rate) 28 02.09.2014
EU projects |------ ~10 nm-------| www.nano4water.eu : Membaq project
NanoH2O company : incorporating nanoparticle in polymer matrix Higher flux, fouling resistance membrane
Water Price trends ($/m3) Ref : Global water market 2008, GWI
Conclusion Desalination and reuse with membrane is a reality • Water quality meets stringent regulations • Barriers operating up to expectations reliable, safe and secure technology Futures Challenges • Improve operations of current treatment trains • Reduce energy, chemicals demand • Water quality: monitoring, regulations • Environmental impact: RO Concentrate • Disruptive technologies : aquaporins, CNT, …