Download
1 / 7
80 likes | 323 Vues
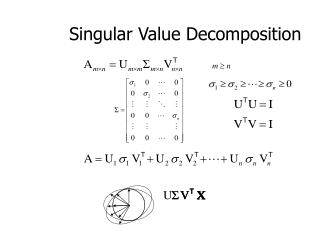
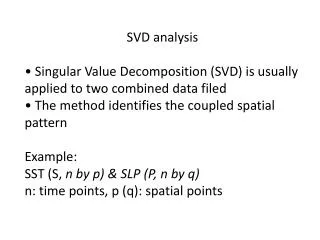
SVD analysis • Singular Value Decomposition (SVD) is usually applied to two combined data filed • The method identifies the coupled spatial pattern Example : SST (S, n by p) & SLP (P, n by q) n: time points, p (q): spatial points. Forming a covariance matrix: C= StP • Apply SVD:

E N D
SVD analysis • Singular Value Decomposition (SVD) is usually applied to two combined data filed • The method identifies the coupled spatial pattern Example: SST (S, n by p) & SLP (P, n by q) n: time points, p (q): spatial points
Forming a covariance matrix: • C=StP • • Apply SVD: • C=ULVt • U is the left pattern (eigenvector for S) • V is the right pattern (eigenvector for P) • Diagonal (L) is the eigenvalue • • The time series (expansion coefficient): • A=SU, B=PV
B&V: ftp://profs.princeton.edu/leo/journals/EOFandSVD/BjornssonVenegasEOFSVDMatlab2000Report.pdf In matlab: Input two variables X1 (N by P) and X2 (N by Q), the left pattern EC p, right pattern EC q , and squared covariance fraction scf are obtained. R=cov([X1,X2]); [u1,s1,v1]=svd(R); d=diag(s1); % eigenvalues p=X1*u1; % left EC q=X2*v1; % right EC scf=d.^2/(sum(d.^2)); %squared covarience First mode if mode ==1: For spatial pattern SP: Left pattern: r1=(X1'*p(:,mode)/(ny-1))./(std(X1)*std(p(:,mode)))'; Homogeneous map (Px1) This standard deviation map is also Px1 Right pattern: r2=(X2'*q(:,mode)/(ny-1))./(std(X2)*std(q(:,mode)))'; Homogeneous map (Qx1) This standard deviation map is also Qx1 For expansion coefficient EC: p(:,mode)./std(p(:,mode)) q(:,mode)./std(q(:,mode)) Looks like R has unit = (Deg/m)*(m/s); see B&V, p.24, sec.3.2, 4th line from below This “r1” (or “r2”) is just the homogeneous correlation map – B&V fig.5.3 caption for S1(SST & S1(SLP) Your EC’s are also the same as B&V fig.5.3 caption for s1(SST & s1(SLP). So all I (we) need to know is just what std(p) & std(q) are