Z-scores
170 likes | 311 Vues
Z-scores. Z-score or standard score. A statistical techniques that uses the mean and the standard deviation to transform each score (X) into a z-score Why z-scores are useful?. Z-scores and location in a distribution. The sign of the z-score (+ or –)

Z-scores
E N D
Presentation Transcript
Z-score or standard score • A statistical techniques that uses the mean and the standard deviation to transform each score (X) into a z-score • Why z-scores are useful?
Z-scores and location in a distribution • The sign of the z-score (+ or –) • The numerical value corresponds to the number of standard deviations between X and the mean
The relationship between z-scores and locations in a distribution
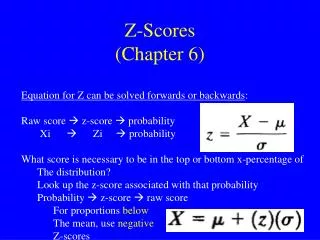
Transforming back and forth between X and z • The basic z-score definition is usually sufficient to complete most z-score transformations. However, the definition can be written in mathematical notation to create a formula for computing the z-score for any value of X. X – μ z = ──── σ Deviation score Standard deviation
Example • If = 95 and = 16 then a score of 124 has a z-score of
Example • For a population with =100 and = 8, find the z-score for each of the following • X= 84 • X=104
What if we want to find out what someone’s raw score was, when we know their z-score? • Example: • Distribution of exam scores has a mean of 70, and a standard deviation of 12. • If an individual has a z-score of +1.00, then would score did they get on the exam?
Another example … • If an individual’s z-score is -1.75, then what score did they get on the exam? • Again using a mean of 70, and a standard deviation of 12.
Transforming back and forth between X and z (cont.) • So, the terms in the formula can be regrouped to create an equation for computing the value of X corresponding to any specific z-score. X = μ + zσ
X = + z So if =80 and = 12 what X value corresponds to a z-score of -0.75?
X = + z =80 = 12 Z-scores X +0.80 -2.34 +1.76 -0.03
Distribution of z-scores • shape will be the same as the original distribution • z-score mean will always equal 0 • standard deviation will always be 1
Using z-scores to make comparisons • Example: • You got a grade of 70 in Geography and 64 in Chemistry. In which class did you do better?
Z-scores and Locations • The fact that z-scores identify exact locations within a distribution means that z-scores can be used as descriptive statistics and as inferential statistics. • As descriptive statistics, z-scores describe exactly where each individual is located. • As inferential statistics, z-scores determine whether a specific sample is representative of its population, or is extreme and unrepresentative.
z-Scores and Samples • It is also possible to calculate z-scores for samples.
z-Scores and Samples Thus, for a score from a sample, X – M z = ───── s Using z-scores to standardize a sample also has the same effect as standardizing a population.