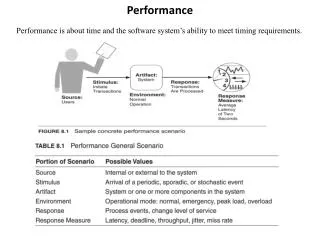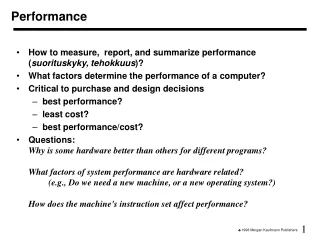

Performance
E N D
Presentation Transcript
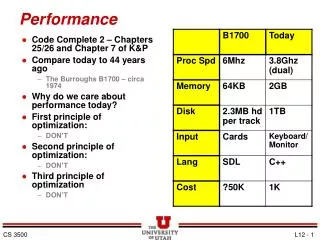
Performance Chapter 2 P&H
Introduction • How does one measure report and sumarise performance? • Complexity of modern systems make it very more difficult to access performance • See through marketing hype • Need to understand performance at multiple levels • Understand why a program performs poorly on a particular processor
c.f. Comercial Airplanes • Which of the following planes has the best performance? • Which of the planes is the fastest? • Can also define computer performance in several ways Airplane Passengers Range (mi) Speed (mph) Throughput Boeing 737-100 101 630 598 60,398 Boeing 747 470 4150 610 286,700 BAC/Sud Concorde 132 4000 1350 178,200 Douglas DC-8-50 146 8720 544 79,424
Performance • Purchasing perspective • given a collection of machines, which has the • best performance ? • least cost ? • best performance / cost ? • Design perspective • faced with design options, which has the • best performance improvement ? • least cost ? • best performance / cost ? • Both require • basis for comparison • metric for evaluation • Our goal is to understand cost & performance implications of architectural choices
Plane DC to Paris Speed Passengers Throughput (pmph) Boeing 747 6.5 hours 610 mph 470 286,700 BAD/Sud Concorde 3 hours 1350 mph 132 178,200 Two notions of “performance” Which has higher performance? ° Time to do the task (Execution Time) – execution time, response time,latency ° Tasks per day, hour, week, sec, ns. .. (Performance) – throughput, bandwidth Response time and throughput often are in opposition
Definitions • Performance is in units of things-per-second • bigger is better • If we are primarily concerned with response time • performance(x) = 1 execution_time(x) " X is n times faster than Y" means Performance(X)n = ---------------------Performance(Y)
Example • Time of Concorde vs. Boeing 747? • Concord is 1350 mph / 610 mph = 2.2 times faster • = 6.5 hours / 3 hours • Throughput of Concorde vs. Boeing 747 ? • Concord is 178,200 pmph / 286,700 pmph = 0.62 “times faster” • Boeing is 286,700 pmph / 178,200 pmph = 1.6 “times faster” • Boeing is 1.6 times (“60%”)faster in terms of throughput • Concord is 2.2 times (“120%”) faster in terms of flying time • We will focus primarily on execution time for a single job
Basis of Evaluation Cons Pros • very specific • non-portable • difficult to run, ormeasure • hard to identify cause • representative Actual Target Workload • portable • widely used • improvements useful in reality Full Application Benchmarks • less representative Small “Kernel” Benchmarks • easy to run, early in design cycle • easy to “fool” • “peak” may be alongway from applicationperformance • identify peak capability and potential bottlenecks Micro benchmarks
SPEC95 • Eighteen application benchmarks (with inputs) reflecting a technical computing workload • Eight integer • go, m88ksim, gcc, compress, li, ijpeg, perl, vortex • Ten floating-point intensive • tomcatv, swim, su2cor, hydro2d, mgrid, applu, turb3d, apsi, fppp, wave5 • Must run with standard compiler flags • eliminate special undocumented incantations that may not even generate working code for real programs
Measuring Performance • Execution Time can be measured in several ways: • Elapsed Time • counts everything (disk and memory accesses, I/O , etc.) • a useful number, but often not good for comparison purposes • CPU time • doesn't count I/O or time spent running other programs • can be broken up into system time, and user time • Our focus: user CPU time • time spent executing the lines of code that are "in" our program
Measuring Performance • On Linux can use time command • E.g. > time tar cvzf pam2001.tgz pam2001 real 0m19.348s user 0m0.930s sys 0m0.660s > time tar cvzf pam2001.tgz pam2001 real 0m1.482s user 0m0.950s sys 0m0.230s