Download
1 / 14
140 likes | 252 Vues
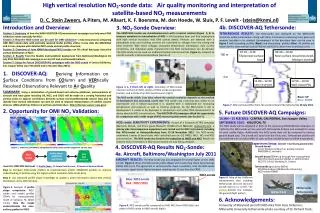
Measurements of Trace Gases at the Manvel Croix and Galveston Sites during DISCOVER-AQ. Objectives: Measurements of trace gases at the two sites in support of DISCOVER-AQ Comparison of surface measurements with aircraft profiling observations

E N D
Measurements of Trace Gases at the Manvel Croix and Galveston Sites during DISCOVER-AQ • Objectives: • Measurements of trace gases at the two sites in support of DISCOVER-AQ • Comparison of surface measurements with aircraft profiling observations • Ozone production efficiency using the correlation between O3 and NOz Paul Kelley1,2, Winston Luke2, Xinrong Ren1,2 1Dept of Atmos. & Oceanic Sci., Univ. of Maryland 2NOAA Air Resources Laboratory
Surface Measurements at Manvel-Croix and Galveston • NOAA: 3-channel NO/NO2/NOY, O3 and SO2. • TCEQ: O3, NO/NOx and Met • Located to SSE of Texas City and SW of downtown Galveston and the Port of Galveston • NOAA: NO2 based on Cavity Ring Down • TCEQ: O3, NO/NOx and Met • Located to S of downtown Houston and SW of the Houston Ship Channel
Diurnal [NO2] Variation at Manvel Croix • Max. [NO2] of 11 ppbv at 7:00-8:00 CST. • Min. [NO2] of 1-2 ppbv in the afternoon • Slightly increasing in early evening: lower boundary heights?
Elevated [NO2] at Manvel Croix • High [NO2] in the winds from NE & N. • Elevated [NO2] in almost all directions: suggesting nearby local emissions.
NO2 at Manvel Croix and Comparison with the P-3 Limit P-3 data at Manvel Croix: (1) below 600 m (2000 ft) (2) within +/-0.02˚ Lat/Long of the site • P3 CL: chemiluminescence • P3 LIF: laser induced fluorescence
P-3 [NO2] vs. surface [NO2] at Manvel Croix Fraction of day Fraction of day • Good agreement in general • More scattered at lower [NO2] later in the day
P-3 [O3] vs. surface [O3] at Manvel Croix Fraction of day • Very good agreement with little dependence on time of day.
P-3 [O3] vs. surface [O3] at Galveston Fraction of day Limit P-3 data at Galveston : (1) below 300 m (1000 ft) (2) within +/-0.02˚ Long/Lat of the site • Good agreement with little dependence on time of day.
P-3 [NO2] vs. surface [NO2] at Galveston Fraction of day • Reasonable agreement in general. • More scattered than Manvel Croix: more horizontal/vertical gradients due to the location of the site.
Wind dependence of [NOY] and [SO2] at Galveston • Highest [NOY] and [SO2] were observed in the winds from NNE , where downtown Galveston and the Port of Galveston are located.
Galveston: [NOZ] (= [NOY] – [NOX]) • Peak NOz (~1.2 ppb) in the afternoon photochemical formation. • Nighttime NOzlevels: relatively constant (~0.7-0.8 ppbv).
Galveston: Ox (=O3+NO2) vs. NOz • Data collected from 10am to 6pm (CST) at the surface • Specific for mean transport times from the emission source regions to Galveston • Assuming minimal depositional loss of NOY species such as HNO3. Similar slopes (14-16) using the P-3 data during the spirals at Galveston and Smith Point.
Summary • High NO2 levels at Manvel Croix were influenced by plumes from downtown Houston and the Houston Ship Channel. • Trace gases at Galveston: relatively low levels, but influenced by pollution plumes. • Comparisons with the P-3 data: good agreement at Manvel Croix and more scattered at Galveston. • Estimated ozone production efficiency of ~16 ppb O3/ppb NOx conversion at Galveston: a factor of 2-3 larger than that during DISCOVER-AQ 2011 in the Baltimore-Washington area.
Acknowledgements • AQRP & TCEQ for support • Jim Thomas, Vince Torresm, and Raj Nadkarni for logistic support • Dave Sullivan and Maria Stanzione for project management support • The P-3 science team for use of the aircraft data • Mark Estes for providing the TCEQ data • Russ Dickerson for loaning instrument supported by AQAST