Download
1 / 17
170 likes | 256 Vues
Detailed overview of instrumentation, mobile sampling, trace gas data, and future work plans for NASA's DISCOVER-AQ project. Focus on emissions, PM formation, and ozone production.

E N D
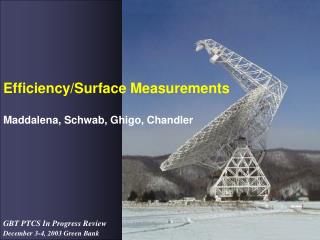
Surface Measurements of PM, VOCs, and Photochemically Relevant Gases in Support of DISCOVER-AQ. J. Flynn, R. J. Griffin, B. Lefer, H. W. Wallace, Y. Leong, B. K. Cevik, R. W. Talbot, P. L. Laine, B. C. Sive, X. Lan, D. Anderson, Y. Zhou, M. Camp
Mobile Laboratory Instrumentation • Basicinstrumentation: • High-resolution marine GPS • RM Young meteorological station (T, P, RH, WS/WD) • RM Young translator (calculates true winds from vehicle motion and measured winds) • NO2 photolysis rate • Common PC based data acquisition • Fore, aft, port, starboard, and sky cameras • Mission instrumentation (DISCOVER-AQ Houston): • UH - O3, CO, CO2, SO2, NO, NO2, NOy, CH4, particle size distribution, PAH on soot • Rice – Aerosol composition (HR-ToF-AMS, Magee Scientific Mini Aethalometer), • UH and Appalachian State – VOCs (Ionicon PTR-MS)
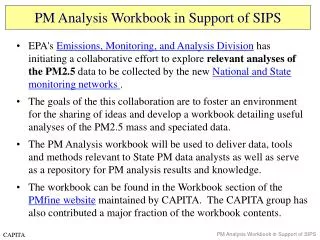
Coordinated MobileSampling Coordinated sampling with 5 labs during DISCOVER-AQ. Left to Right: Chalmers, NASA LaRC, Aerodyne, UH, Princeton
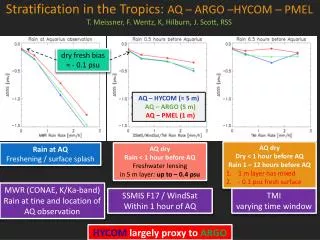
Trace Gas Data Elevated O3at the end of the campaign. Excluding Calibrations and Maintenance Periods 455 hrs of data (120 hrs (26%) on-road)
Future Work • Upgrade CO and O3 instruments for 1s response • Calculate ozone production rates for DAQ (Photochemical box modeling). • OH and peroxy-radical sources and sinks (upwind vs downwind transects). • Examine PM formation (relationship between oxygenated VOCs and PM) • PM chemical speciation to investigate potential sources • Relative importance of biogenic emissions on ozone and PM formation
Future Work • Generate emission factors for chemically resolved PM (g PM type/ L fuel) for diesel and gasoline vehicles. • Identify individual vehicle plumes in the data. Sort into speed, age, engine type bins. • Calculate PM-to-NOx and PM-to-CO ratios using linear regressions. • Use calculated ratio and literature emission factors to estimate PM emissions factors. • Use PTR-MS data and PM data with emissions maps and plume modeling to derive particulate emissions inventories for the refineries?
Acknowledgements • AQRP