WT TG
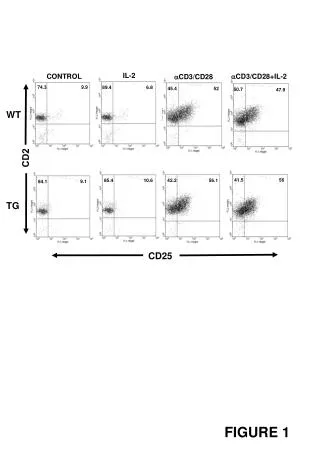
IL-2. CONTROL. CD3/CD28+IL-2. CD3/CD28. 74.3 9.9. 89.4 6.8. 45.4. 52. 50.7. 47.9. WT TG. CD2. 41.5. 56. 85.4. 10.6. 56.1. 42.2. 9.1. 84.1. CD25. FIGURE 1. WT. TG. 20000. 18000. 16000. 14000. Thymidine Uptake (cpm).

WT TG
E N D
Presentation Transcript
IL-2 CONTROL CD3/CD28+IL-2 CD3/CD28 74.3 9.9 89.4 6.8 45.4 52 50.7 47.9 WT TG CD2 41.5 56 85.4 10.6 56.1 42.2 9.1 84.1 CD25 FIGURE 1
WT TG 20000 18000 16000 14000 Thymidine Uptake (cpm) 12000 10000 8000 6000 4000 2000 0 IL-2 IL-2 Control Control CD3/CD28 CD3/CD28 IL-2 + CD3/CD28 IL-2 + CD3/CD28 FIGURE 2
0,6 70 120 60 0,5 100 50 0,4 80 WT WT TG TG 40 0,3 60 30 ** 0,2 40 20 1200 0,1 20 10 1000 0 0 0 800 IL-10 (ng/mL) IL-4 (pg/mL) 2,5 600 400 2 200 1,5 0 1 * * ** 0,5 0 IL-13 (pg/mL) IFN- (ng/mL) Unstimulated IL-2 (ng/mL) Anti-CD3/CD28 FIGURE 3
WT TG WT TG 70 * * 60 50 CD4+ 40 PERCENTAGE OF CELL NUMBER CD8+ 30 20 10 0 Unstimulated anti-CD3/28 WT TG WT TG 70 * * 60 50 * CD4+ 40 * PERCENTAGE OF CELL NUMBER 30 CD8+ 20 10 0 IL-2 IL-2 + anti-CD3/28 FIGURE 4
WT TG 70 140 60 120 * * 50 100 CELL NUMBER % CELL NUMBER 40 80 30 60 20 40 10 20 0 0 T CD4 CD8 WT TG FIGURE 5