Download
1 / 23
230 likes | 357 Vues
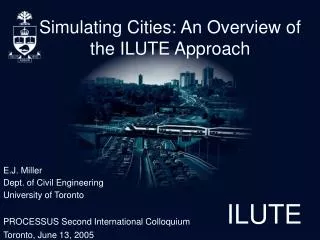
Simulating Cities: An Overview of the ILUTE Approach. E.J. Miller Dept. of Civil Engineering University of Toronto PROCESSUS Second International Colloquium Toronto, June 13, 2005. Presentation Outline. Urban Form – Transportation Interactions Need for Integrated Urban Models

E N D
Simulating Cities: An Overview of the ILUTE Approach E.J. Miller Dept. of Civil Engineering University of Toronto PROCESSUS Second International Colloquium Toronto, June 13, 2005
Presentation Outline • Urban Form – Transportation Interactions • Need for Integrated Urban Models • Microsimulation • The ILUTE Project • Key Features of ILUTE • Modelling Activity/Travel -- TASHA
Transportation and urban form are fundamentally linked. How we build our city directly determines travel needs, viability of alternative travel modes, etc. Transportation, in turn, influences land development and location choices of people & firms.
Employment distributions and densities, in particular, have enormous impacts on travel mode choice. 1996 Employment Levels, GTA (Source: Haider, 2003) There are many major employment areas in the GTA, but the Toronto downtown is by far the greatest density centre. 1996 Employment Densities, GTA (Source: Haider, 2003)
Demographics Travel Demand Network Flows To understand these complex transportation – urban form interactions and to analyse the wide variety of policies (transportation, housing, etc.) that affect the urban system requires integrated, comprehensive models of transportation and land use. INPUTS URBAN ACTIVITY SYSTEM TRANSPORTATION SYSTEM Land Development Transportation Network Location Choice Automobile Ownership Regional Economics Activity Schedules Government Policies Activity Patterns
Example Application: The Toronto Waterfront What would be the impact of tearing down the Gardiner Expressway? What if it wasn’t replaced? What transit options might exist? What would be the impact on population & employment distributions? … 2030_A Target Year (Policy Option A) 2005 evolve Base Year branchand evolve 2010 2030_B Target Year (Policy Option B) Event Year 2030_C Target Year (Policy Option C)
Example Application: Places to Grow • What will be the impact of a greenbelt on: • housing density & prices? • employment concentration? • transit viability? • congestion? • emissions? • …
Simulation Applications Given the size and complexity of urban systems, a primary tool in the analysis of these systems is simulation, typically at the micro level of individual vehicles, trip-makers, households, etc. The PROCESSUS Network is actively developing and applying microsimulation models of transportation networks and urban systems.
Microsimulation t = t0 • “Micro” implies a highly disaggregated model: • spatially • socio-economically • (representation of actors) • representation of processes • “Simulation” implies: • numerical • dynamic (time dimension • explicit) • stochastic • end state is “evolved” rather than • “solved for” Synthesis of Base Sample For t = t0 Endogenous Changes to Sample during this Dt Exogenous Inputs this Dt t = t + Dt Disaggregate Behavioral Model Behavior/System State at (t + Dt)
Why Microsimulate? To explore alternative futures and “emergent behaviour”. Static equilibrium projection VKT Trend Projection Dynamic, path-dependent response to policy initiatives Historical Trend Time Base Year Forecast Horizon
The ILUTE Modeling Project Demographics Land Use In Canada, the PROCESSUS Network is working on microsimulation modelling within the Integrated Land Use, Transportation, Environment (ILUTE) Modelling Project. Regional Economics Location Choice Auto Ownership Government Policies Activity/Travel & Goods Movement Transport System Dynamic Traffic Assignment Model Flows, Times, etc. External Impacts
Schedule Agenda Household Building Zone Vehicle Dwelling Unit Person 1 Person 1 Firm Job Worker Agenda Schedule Agenda Schedule Agenda Object-Oriented, Agent-Based Models • The model is being developed within the OOP paradigm • OOP ideal for microsimulation applications • Model design focuses on definition of the objects which exist • & interact within the system • An intelligent object is an agent. • Agents: • perceive the world • around them • make autonomous • decisions • act into the world
ILUTE Temporal / Spatial (Physical World) Representation Markets: Agent Interactions Scheduling/Planning: Agent Decision-Making The ILUTEPyramid
Become Active in the Market Constrained Search Microsimulating Markets Many markets are of interest within ILUTE (housing, labour, commercial real estate, etc.). Market interaction is a three-stage process: Bidding & Search Termination
Household-Level Models Household Allocation of resources, assignment of tasks • Household-level models are required to “properly” deal with many system components: • housing location/type choice • automobile ownership • demographics/household • structure/lifecycle stage • activity/travel scheduling • Households: • share resources among household • members • constrain member behavior • condition member decision-making • generate activities Requests for resources, availability for tasks Person 1 Person 2 Pers1 Pers 2 Car 1 Time Request for car Allocation of the car to a given person
Software Status Development of the initial operational model is complete, documented as part of Ph.D. thesis, "ILUTE: An Operational Prototype of a Comprehensive Microsimulation Model Of Urban Systems" by Paul Salvini (2003) • Operational prototype running with • GTA 1996 base • Over 15,000 lines of C++ code in 60 • classes • Fully documentation in UML • Runs on any Windows workstation • Ready for additional sub-models
Modelling Daily Activity & Travel Many problems exist with conventional urban travel demand forecasting models that limit the ability of such models to deal effectively with modern, complex urban transportation systems, especially the competition between auto and transit for travel markets. The PROCESSUS Network is contributing to a world-wide effort to develop “next generation” models that have a sounder behavioural base so as to improve their credibility and their policy sensitivity.
TASHA • One example of this work is TASHA (Travel/Activity Scheduler for • Household Agents). A second prototype version of the model • is expected to be operational by mid-summer. Key features include: • Activity-based • Household-based (only such model currently in existence) • Microsimulation-based • Agent-based, object-oriented • Capable of interfacing with either conventional aggregate • modelling systems or new disaggregate microsimulators at both • “input” and “output” ends of the model (unique to this model)
Scheduling Episodes • Project 1 • episode 1.1 • episode 1.2 • …. • Project N • episode N.1 • episode N.2 • …. • Project 2 • episode 2.1 • episode 2.2 • …. …… Day 1 Day 2 Day 3 Day 4 Day 5 Day 6 Day 7
Chain c: 1. Home-Work 2. Work-Lunch 3. Lunch-Meeting 4. Meeting-Work 5. Work-Home Tour-Based Mode Choice Drive Option for Chain c Non-drive option for Chain c m1 = drive m5 m4 m3 Sub-Chain s: 2. Work-Lunch 3. Lunch-Meeting 4. Meeting-Work m2 m1 mN = mode chosen for trip N Drive for Sub-chain s Non-drive for Sub-chain s m2 = drive m3 = drive m4 = drive m4 m3 m2 m5 = drive
TASHA Application: GTA Growth & Transportation Impacts Pop. Growth Rate Pop. Growth Rate In a “Business as Usual” scenario with respect to GTA growth and transit system investment, auto usage is projected to grow faster than population; transit usage will grow at about half the rate of population.
Thank you. Highway 401 & Allen Road Interchange UofT Paramics simulation model ILUTE Model Output