Download
1 / 63
630 likes | 803 Vues
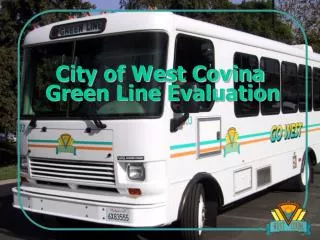
City of West Covina. Green Line Evaluation. Presented By. California State Polytechnic University, Pomona Graduate Students. Ana Rosales Enrique Salgado Shannon Williams Alicia Velazquez. Joanne Coletta Jim Jobst Leticia Llamas Kelly McDonald. Dr. Sandra Emerson.

E N D
City of West Covina Green Line Evaluation
Presented By California State Polytechnic University, Pomona Graduate Students Ana Rosales Enrique Salgado Shannon Williams Alicia Velazquez Joanne Coletta Jim Jobst Leticia Llamas Kelly McDonald Dr. Sandra Emerson Green Line Evaluation
Background & Context Presented by: Joanne Coletta
Needs to Be Met By the Program Green Line Evaluation
Project Description • Target Population • Program History, Funding & Issues • Program Implementation & Rationale Green Line Evaluation
Project Description Green Line Evaluation
Project Description • Program History • Funding • Issues Green Line Evaluation
Program Implementation & Rationale Green Line Evaluation
Study Questions & Criteria Study Designs & Methods Presented by: Leticia Llamas
Study Questions What is the one thing we should know about the city & Green Line? What is the one thing you would like to know by the end of the project? What are important criteria & what kind of evidence do you need?
Criteria Diversity Shift in Patron Needs Quality and Viability Impact on Quality of Life Impact of Service on Business
Study Designs & Methods Ridership Survey Records Analysis Field Observation
Study Designs & Methods Records Analysis • Data Reports from Contractor • Budget & Expenditure Reports from City
Study Designs & Methods Ridership Survey • Demographics • Purpose of Travel • Satisfaction with Service • Areas for Improvement
Study Designs & Methods • Activity Within The Bus • Bus Stop Conditions Field Observation
Records Analysis Presented by: Enrique Salgado
EXTRABOLATED DATA RED/BLUE 1997-98 1998-99 1999-00 2000-01 2001-02 Ridership (average/m0) 12773.58 11339.33 13075.50 11415.34 9931.34 % Change from prior year n.a. -11% 15% -13% -13% COSTS ($) $506,957 $487,707 $516,209 Average Cost/Mo $42,246 $40,642 $43,017 Cost/Rider/Mo ($) $3.23 $3.56 $4.33 Cost/Hour/Mo ($) $42.50 $35.69 $32.85 GREEN Ridership (average/mo) $7,073.07 COSTS ($) $272,409.55 Average Cost/Mo $22,700.00 Cost/Rider/Mo ($) $3.21 Cost/Hour/Mo ($) $42.33 Cost Comparison Green Line Evaluation
Red/Blue Ridership Trend Green Line Evaluation
Green Ridership Trend Green Line Evaluation
Field Observations and Quality of Service Findings Presented by: Alicia Velazquez
Research Questions • Bus users • Schedule • Bus Condition • Drivers Green Line Evaluation
Description of Findings (Users) On Average: 10 users per bus ride (Adults: 2, Youth: 7, Seniors: 1, Disabled: 0) Green Line Evaluation
Description of Findings (Schedule) 31 Trips: 54% = on schedule, 45% = off schedule (2 min) Green Line Evaluation
Description of Findings (Conditions) Green Line Evaluation
Explanation of Findings (Bus Stop Conditions) Lark Ellen/ Francisquito max rating: 4 Shadow Oaks/ Nogales max rating: 5 Sentous/ Valley max rating: 5 Green Line Evaluation
Description of Findings Courtesy of Drivers * 3 – Does Not Necessarily Denote a Problem. Green Line Evaluation
Field Observations Presented by: Enrique Salgado
Field Observations Rider Traffic Weekend Weekday 147% more Green Line Evaluation
Field Observations Noise Levels Morning Mid Day Afternoon and Evening Green Line Evaluation
Field Observations Driver Courtesy Morning Mid Day Afternoon and Evening Green Line Evaluation
Customer Survey Presented by: Kelly McDonald
Interviews with Staff Review of Records Customer Survey Development Focus Group With Commission Subcommittees Field Observations The Survey Green Line Evaluation
The Survey Two Surveys – User & Non-User Demographics (Ranges) Purpose of Trip – Spending (Ranges) Satisfaction & Alternatives or Why Not Using Green Line Evaluation
Implementation Implementation Conduct the Survey Data Analysis The Bait Green Line Evaluation Green Line Evaluation
Customer Satisfaction Green Line Evaluation
Suggested Improvements 31.3 % Bus Schedule 7.8 % Stop Locations 7.8 % Transfers 6.3 % Driver Courtesy 39.1 % No Comment Green Line Evaluation
Where Are Riders Going? 32.6 % Senior Center Green Line Evaluation
Where Are Riders Going? 34.2 % Shopping 15.9 % Westfield, Eastland, & Fashion Square Green Line Evaluation
Data Suggests Boarding - Departure Incidental shopping at South-end outlets Estimated Spending Transfer to Other Lines Green Line Evaluation Budget Project
Summary Achieving Objectives Some Improvements - High Satisfaction As Defined - Highly Effective Service Green Line Evaluation Budget Project
Respondent Description & Inferences Presented by: Shannon Williams
Description of Customer Survey Respondents • 102 Respondents • Mix of Youth, Adults, & Seniors Green Line Evaluation
Characteristics of Customer Survey Respondents Customer Survey Respondents by Age Categories Green Line Evaluation
Customer Survey Respondents by Gender Green Line Evaluation
Customer Survey Respondents by Income Groups Green Line Evaluation
Respondent’s Use of West Covina Transit System Green Line Evaluation
Customer Survey Inferences Satisfaction regarding bus safety differences by age categories Green Line Evaluation
Satisfaction with bus schedule differences by age categories Green Line Evaluation
Open-Ended Survey Suggestions for Improvements Bus Schedule Bus Stops • More often • Travel in both directions • Coordinate with FHT • More stops • Information on connections • Shelters • Visible bus signs • Transfer Politeness • Slowing down at stops & waiting Green Line Evaluation
Alternative transportation if no transit by age groups Green Line Evaluation