Download
1 / 28
340 likes | 729 Vues
Chapter 13 Inventory Systems for Independent Demand. This section explores: The definition and purpose of inventory Inventory costs Independent vs. dependent demand Types of inventory systems. What is Inventory?.

E N D
Chapter 13Inventory Systems for Independent Demand • This section explores: • The definition and purpose of inventory • Inventory costs • Independent vs. dependent demand • Types of inventory systems
What is Inventory? • Inventory is the stock of any item or resource used in an organization, such as: • Raw materials • Finished products • Component parts • Supplies • Work in process (or progress)
Why Carry Inventory? (Pros) 1. To maintain independence of operations 2. To meet variation in product demand 3. To allow flexibility in production scheduling 4. To provide a safeguard for variation in raw material delivery time 5. To take advantage of large purchase discounts
Inventory Carrying and Changing Costs (Cons) • Carrying costs (most significant) • Interest (capital opportunity cost) • Setup (or production change) costs • Tooling • Ordering costs • Shortage costs • Difficult to evaluate e.g. loss of goodwill.
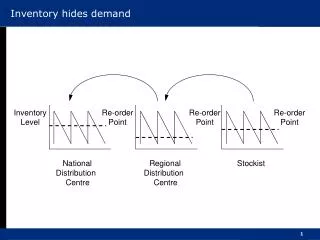
Independent vs. Dependent Demand Independent Demand (Demand not related to other items) Dependent Demand (Derived from other higher level items) E(1) ....
Inventory Systems and Models • Inventory systems provide the organizational structure and the operating policies for controlling materials to be stocked • Two general types of system models: • Fixed-Order Quantity (or Economic Order Quantity, EOQ or Q) Models: Event triggered • Fixed-Time Period (or periodic system fixed-order interval or P) Models: Time triggered
Comparison of Q and P Inventory Systems Feature Order quantity When to order Recordkeeping Inventory size Labor to maintain Types of items Fixed-Order Quantity (Q) Constant: same amount order- ed each time. When quantity on hand drops to reorder level Each time items removed or added Less than fixed-time period Higher due to continuous record- keeping High-priced and critical items Fixed-Time Period (P) Variable: different each time order is made When the review period arrives Inventory counted only at review period Larger than fixed-order quantity
Fixed-Order Quantity (Q) System Idle state Waiting for demand Demand occurs Unit withdrawn from inventory or back ordered No Is status < Reorder point? Compute inventory status Status = On hand + On order - Back order Yes Issue order for Exactly Q units
Fixed-Time Period Quantity (P) System Idle state Waiting for demand Demand occurs Unit withdrawn from inventory or back ordered Has review time arrived? No Yes Compute inventory status Status = On hand + On order - Back order Issue order for quantity needed Compute order quantity to bring inventory to desired level
Some Comments on Inventory Systems • The cost to carry inventory is 25-35% of the inventory’s worth annually. Therefore, inventory reduction is one strategy for reducing cost. • It is important to match the system used to the operational results desired. It is not wise to focus only on reducing inventory costs or a particular element of the cost. • The inventory control systems discussed apply to manufacturers. Service and retail firms usually use simpler control methods.
Fixed-Order Quantity ModelsAssumptions • Demand for the product is constant and uniform throughout the period • Lead time (time from ordering to receipt) is constant • Inventory holding cost is based on average inventory • Ordering and setup costs are constant • All demand for product are satisfied i.e. backorders are not allowed • Price per unit of product is constant ....
Q Q Q R L L Time EOQ Model--Basic Fixed-Order Quantity Model Number of units on hand R = Reorder point Q = Economic order quantity L = Lead time ....
Cost Minimization Goal C O S T Total Cost Holding Costs Annual Cost of Items (DC) Ordering Costs QOPT Order Quantity (Q) ....
Annual Purchase Cost Annual Ordering Cost Annual Holding Cost Total Annual Cost = + + Basic Fixed-Order Quantity Model TC Total annual cost D Demand C Cost per unit Q Order quantity S Cost of placing an order or setup cost R Reorder point L Lead time H Annual holding and storage cost per unit of inventory ....
Deriving the EOQ • Using calculus, we take the derivative of the total cost function and set the derivative (slope) equal to zero ....
EOQ Example Annual Demand = 1,000 units Days per year considered in average daily demand = 365 Cost to place an order = $10 Holding cost per unit per year = $2.50 Lead time = 7 days Cost per unit = $15 Determine the economic order quantity and the reorder point. ....
Solution ....
In-Class Exercise Annual Demand = 10,000 units Days per year considered in average daily demand = 365 Cost to place an order = $10 Holding cost per unit per year = 10% of cost per unit Lead time = 10 days Cost per unit = $15 Determine the economic order quantity and the reorder point. Note: (Tag hidden-slide icon to project solution) ....
Compute inventory status Status = On hand + On order - Back order Compute order quantity to bring inventory up to required level Issue an order for the number of units needed Fixed-Time Period Model No Is status < Reorder point? Yes Idle state Waiting for demand Demand occurs Unit withdrawn from inventory or back ordered ....
Determining the Value of T+L • The standard deviation of a sequence of random events equals the square root of the sum of the variances ....
Example--Fixed-Time Period Model Daily demand for a product is 20 units. The review period is 30 days, and lead time is 10 days. Management has set a policy of satisfying 96 percent of demand from items in stock. At the beginning of the review period there are 200 units in inventory. The daily demand standard deviation is 4 units. How many units should be ordered? ....
Solution (continued) Z-value for 96% probability of satisfying demand is 1.76 see normal curve probability table. To satisfy 96 percent of demand order 779 units at this review period. ....
Miscellaneous SystemsOptional Replenishment System Maximum Inventory Level, M q = M - I Actual Inventory Level, I M I Q = minimum acceptable order quantity If q > Q, order q. ....
Miscellaneous SystemsBin Systems Two-Bin System Order One Bin of Inventory Full Empty One-Bin System Order Enough to Refill Bin Periodic Check ....
60 % of $ Value A 30 B C 0 % of Use 30 60 ABC Classification System • Items kept in inventory are not of equal importance in terms of: • dollars invested • profit potential • sales or usage volume • stock-out penalties ....
Inventory Accuracy and Cycle Counting • Inventory accuracy • Do inventory records agree with physical count? • Cycle Counting • Frequent counts • Which items? • When? • By whom? .... Last Slide