Independent-Demand Inventory
440 likes | 580 Vues
Independent-Demand Inventory. Chapter 15. Chapter 15 Outline. Introduction Purpose of Inventories Inventory Cost Structures Independent versus Dependent Demand Economic Order Quantity Continuous Review System Periodic Review System Using P and Q System in Practice

Independent-Demand Inventory
E N D
Presentation Transcript
Independent-Demand Inventory Chapter 15
Chapter 15 Outline • Introduction • Purpose of Inventories • Inventory Cost Structures • Independent versus Dependent Demand • Economic Order Quantity • Continuous Review System • Periodic Review System • Using P and Q System in Practice • ABC Inventory Management
Introduction • Inventory: a stock of materials used to facilitate production or to satisfy customer demand. • Types of inventory • Raw materials (RM) • Work in process (WIP) • Finished goods (FG) • Maintenance, repair & operating supplies (MRO)
A Material-Flow Process Productive Process Work in process Raw Materials Work in process Finished goods Vendors Customer Work in process
A Water Tank Analogy for Inventory Inventory Level Supply Rate InventoryLevel Demand Rate
Purpose of Inventories (1) • To protect against uncertainties • in demand (finished goods, MRO) • supply (RM, MRO) • lead times (RM/PP or WIP) • schedule changes (WIP) • To allow economic production and purchase (as in discounts for buying RM/PP in bulk)
Purpose of Inventories (2) • To cover anticipated changes in demand (as in a level strategy) or supply • finished goods • RM/PP • To provide for transit (pipeline inventories) • RM/PP • finished goods • WIP (independence of operations)
Inventory Cost Structures (1) • Item or SKU cost • Expressed as cost per unit or SKU. Gets into LIFO and FIFO issues. • Problem can be compounded by quantity discounts.
Inventory Cost Structures (2) • Ordering (or setup) cost • Paperwork, worker time (ordering) • worker time, downtime (setup) • Typically expressed as a fixed cost per order or setup.
Inventory Cost Structures (3) • Carrying (or holding) cost: • Cost of capital (market rate or internal rate of return) • Cost of storage (building, utilities, insurance, handling) • Cost of obsolescence, deterioration, and loss (shrinkage) • Management cost (record keeping, counting) • Typically expressed as a percentage of SKU cost. Average in U.S. is estimated to be 35 percent per year. • Businesses often use only cost of capital (understatement).
Inventory Cost Structures (4)How the 35 percent carrying cost is distributed • Cost of Capital—9-20 percent • Obsolescence—2-5 percent • Storage—2-5 percent • Material Handling—1-3 percent • Shrinkage—1-3 percent • Taxes & Insurance—1-3 percent Source: Mark Williams, APICS Instructor Listserv, 22 January 2001
Inventory Cost Structures (5) • Stock out cost (back order or lost sales) • record maintenance • lost income • customer dissatisfaction • Typically expressed as a fixed cost per backorder or as a function of aging of backorders.
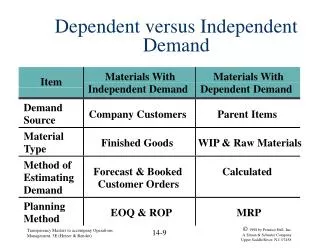
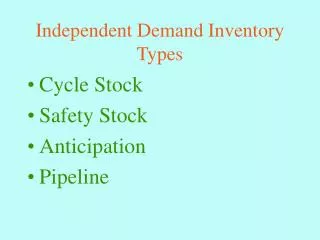
Two Forms of Demand (1) • Independent demand(this chapter) • finished goods, spare parts, MRO • based on market demand • requires forecasting • managed using ‘replenishment philosophy’, i.e. reorder when reach a pre-specified level.
Two Forms of Demand (2) • Dependent demand(next two chapters) • parts that go into the finished products, RM/PPorWIP • dependent demand is a known function of independent demand • calculate instead of forecast • Managed using a ‘requirements philosophy’, i.e. only ordered as needed for higher level components or products.
Independent versus Dependent Demand A pattern plus random influences ‘Lumpy’ because of production lots
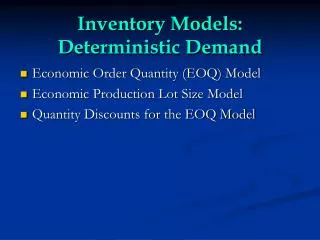
Economic Order Quantity (EOQ) • Developed in 1915 by F.W. Harris • Answers the question ‘How much do I order?’ • Used for independent demand items. • Objective is to find order quantity (Q) that minimizes the total cost (TC) of managing inventory. • Must be calculated separately for each SKU. • Widely used and very robust (i.e. works well in a lot of situations, even when its assumptions don’t hold exactly).
Economic Order Quantity (EOQ)Basic Model Assumptions • Demand rate is constant, recurring, and known. • Lead time is constant and known. • No stockouts allowed. • Material is ordered or produced in a lot or batch and the lot is received all at once • Costs are constant • Unit cost is constant (no quantity discounts) • Carrying cost is a constant per unit (SKU) • Ordering (setup) cost per order is fixed • The item is a single product or SKU.
EOQ Lot Size Choice • There is a trade-off between frequency of ordering (or the size of the order) and the inventory level. • Frequent orders (small lot size) lead to a lower average inventory size, i.e. higher ordering cost and lower holding cost. • Fewer orders (large lot size) lead to a larger average inventory size, i.e. lower ordering cost and higher holding cost.
EOQ Inventory Levels(‘sawtooth model’) Order Interval On Hand Lot size = Q Average Inventory Level = Q/2 Time
Notations and measurement units in EOQ D = Demand rate, units per year S = Cost per order placed, or setup cost, dollars per order C = Unit cost, dollars per unit i = Carrying rate, percent of value per year Q = Lot size, units TC= total of ordering cost plus carrying cost
Cost Equations in EOQ Ordering cost = (cost per order) x orders per year) = SD/Q Carrying cost per year = (annual carrying rate) x (unit cost) x average inventory = iCQ/2 Total annual cost (TC) = ordering cost per year + carrying cost per year = SD/Q + iCQ/2
TC and EOQ TC = ordering cost + holding cost = S*(D/Q) + iC*(Q/2) EOQ = note: Although we have used annual costs, any time period is all right. Just be consistent! The same is true for currency designations.
EOQ Example Sales = 10 cases/week S = $12/order i = 30 pct/year C = $80/case _________ EOQ = (2SD)/iC = SQRT[(2*12*10*52)/(80*.3)] = SQRT[12,480/24] = 22.8 cases/order TC = ordering cost + holding cost = S*(D/Q) + iC*(Q/2) = 10(520/22.8) + 24 * 11.4 = 228.70 + 273.60 = $547.28/year If order 22 cases instead, TC = $547.64; if 23, TC = $547.30
Continuous Review System • Relax assumption of constant demand. Demand is assumed to be random. • Check inventory position each time there is a demand (i.e continuously). • If inventory position drops below the reorder point, place an order for the EOQ. • Also called fixed-order-quantity or Q system (the fixed order size is EOQ).
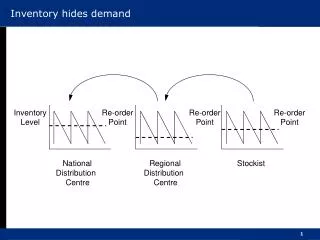
A Continuous Review (Q) System R = Reorder Point Q = Order Quantity L = Lead time
A Continuous Review (Q) System Amount to order = EOQ Order when inventory position = reorder point. Reorder point = lead time * demand/period = R = lead time demand (when demand is constant) Reorder point is independent of EOQ! EOQ tells how much to order. Reorder point tells when to order.
Service Level • When demand is random, the reorder point must take into account the service level or fill rate. • Service level has many definitions: • Probability that all orders will be refilled while waiting for an order to arrive. • Percentage of demand filled from stock in a time period. • Percentage of time the system has stock on hand.
Probability Distribution of Demand over Lead Time m = mean demand R = Reorder point s = Safety stock
Periodic Review System (1) • Instead of reviewing continuously, we review the inventory position at fixed intervals. For example, the bread truck visits the grocery store on the same days every week. • Also known as “P system”, “Fixed-order-interval system” or “Fixed-order-period system”
Periodic Review System (2) • Each time we review the inventory, we either order or don’t. The decision depends upon our reorder point. • The amount we order may be fixed, or may be the amount needed to bring us up to a target (T).
Time Between Orders (P) andTarget Level (T) Calculation Where: T = target inventory level m’ = average demand over P+L s’ = safety stock
Using P and Q System in Practice • Use P system when orders must be placed at specified intervals. • Use P systems when multiple items are ordered from the same supplier (joint-replenishment). • Use P system for inexpensive items.
Using P and Q Systems in Practice • P may be easier to use since levels are reviewed less often. • P requires more safety stock since may only order at fixed points. • P is more likely to run out since cannot respond to increases in demand immediately • Either may be more costly: P in safety stock, Q in monitoring cost.
ABC Inventory Management (1) • Based on “Pareto” concept (80/20 rule) and total usage in dollars of each item. • Classification of items as A, B, or C based on usage. • Purpose is to set priorities on effort used to manage different SKUs, i.e. to allocate scarce management resources.
ABC Inventory Management (2) • ‘A’ items: 20% of SKUs, 80% of dollars • ‘B’ items: 30 % of SKUs, 15% of dollars • ‘C’ items: 50 % of SKUs, 5% of dollars • Three classes is arbitrary; could be any number. • Percents are approximate. • Danger: dollar use may not reflect importance of any given SKU!
ABC Chart for Table 15.4 A B C
Managing A items: Diamonds
Summary • Introduction • Purpose of Inventories • Inventory Cost Structures • Independent versus Dependent Demand • Economic Order Quantity • Continuous Review System • Periodic Review System • Using P and Q System in Practice • ABC Inventory Management