met.sjsu/~jin
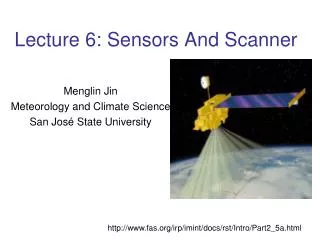
METR 112 Global Climate Change Professor Menglin Susan Jin San Jose State University, Dept of Meteorology and Climate Science. www.met.sjsu.edu/~jin. January 22, 201 4. Outline of today’s lecture Introduction and Welcome Discussion on the “greensheet” Learning Contract

met.sjsu/~jin
E N D
Presentation Transcript
METR 112 Global Climate Change Professor Menglin Susan Jin San Jose State University, Dept of Meteorology and Climate Science www.met.sjsu.edu/~jin January 22, 2014
Outline of today’s lecture • Introduction and Welcome • Discussion on the “greensheet” • Learning Contract • First glance on observations of Changing Climate
For greensheet, class ppt notes http://www.met.sjsu.edu/~jin/METR112spring2014.htm NOT any other websites!
About Professor A very good scholar www.met.sjsu.edu/~jin 1. Research projects: funded by NASA, NSF, Department of Defense On land surface climate change, urbanization, remote sensing 20+ leading author papers on top journals 2. an effective teacher • Teaching philosophy: teaching is your responsibility, • but a good professor makes things so easy for you
Goal METR112 will help you to know the fundamentals of global climate system, climate change, and gain appreciation of the complexities involved with climate change issues Being educated in Climate Change Issue
Homework: 20% Midterm Exam: 20% Class Participation 5% Group Project: 20% Final Exam: 35% Scale: 90+ A, 80’s B, 70’s C, 60’s D, <60 F Homework will be assigned on in class Submitted on time via canvas.
Content • 1. Knowledge on Climate System: • Atmosphere Structure • Land Surface Properties • Land-Ocean-Atmosphere Interaction • Global Energy Balance • Global Hydrological Cycle • C cycle • Glacier • Aerosols and clouds • Ozone • 2. Past Climate Change • 3. Recent Climate Change • 4. Climate Modeling – Its basics and Uncertainty • 5. Climate Feedback • 6. Urban Climate Change – Land Cover Change and Human Impacts • 7. Climate Change and Human Health • 8. Remaining Questions on Global Climate Change Research • 9. 10 Things You can do to Fight Climate Change
Lecture Hour: METR112-01: TTH 10:30 -11:45 AM METR112-03: TTH 1:30 PM – 2:45 PM Place: DH515 Office Hour: 12:30 PM -1:20 PM, TH more (set via email) Place: MSJ’s Office (DH613) TA: TBD TA’s office: TBD METR112 • I will meet with you for extra office hour whenever you need. • send email for appointment. I am approachable!!!
References (not a text book): (cheap!) “Understanding Weather & Climate” by Edward Aguado and James E. Burt (Third Edition) Video collections: http://www.met.sjsu.edu/metr112-videos/ Useful materials will be assigned on webpage/homework/class
Learning Contract • Instructor • On time and prepared. • Answers questions. • Approachable and friendly. • Fair with assignments and grades. • Genuinely concerned about your learning and intellectual development.
Learning Contract • Students • Make every effort to arrive on time; and if late, enter class quietly. • Preserve a good classroom learning environment by a) refraining from talking when other people are talking b) turning off cell phones. • Be courteous to other students and the instructor. • Aware that learning is primarily their responsibility. • Aware of universities policy on academic integrity and pledge to abide by them at all times. • Have read and understand what plagiarism is and know how to cite sources properly.
Academic Integrity • Integrity of university, its courses and degrees relies on academic standards. • Cheating: • Copying from another’s test, cheatsheet etc. • Sitting an exam by, or as, a surrogate. • Submitting work for another • Plagiarism: • Representing the work of another as one’s own (without giving appropriate credit)
Plagiarism • Judicial Affairs http://sa.sjsu.edu/judicial_affairs/index.html • Look at the Student Code of Conduct • Read through SJSU library site on Plagiarism http://www.sjlibrary.org/services/literacy/info_comp/plagiarism.htm • http://turnitin.com/
GreenSheet (see handout) • Homework mustonline turnin (canvas) • Class Participation • Research Project • Final grade
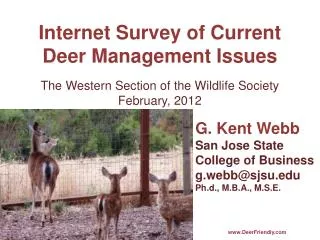
July 21, 2012, Beijing the heaviest rainfall in 61 years fell on the Chinese capital city of Beijing on July 21, 2012. The state news agency Xinhua at first said that 37 people had been killed by floods during and after the downpour, but today (July 26, 2012) the official death toll was raised to 77
Extreme to 200mm Affect 1.9million people, 10 billons $ damage
A car moves on the rain-inundated road in the Daxing District of Beijing, capital of China, July 21, 2012.
Mechanisms for extreme rainfall over BJ: Why Beijing? Why Now? Urban landscape enhance rainfall via three processes: Aerosol-cloud interactions UHI Canyon effect Knowledge abut climate sysetm and climate change is needed
Two main points in this figure • Globalmean surface temperatures have increased 0.5-1.0°C since the late 19th century • The 20th century's 10 warmest years all occurred in the last 15 years of the century Note: 1. why is global mean? 2. what is surface air temperature? (see next few slides)
Temperature is measured by therometer Thermoeter is required by WMO (see next slide)
World Meteorological Organization (WMO) http://www.wmo.int/pages/index_en.html Weather station http://www.nationmaster.com/encyclopedia/Image:Translational-motion.gif
Observed temperature changes Warming due to El Niño 1992-93 Cooling due to Mt. Pinatubo Cooling due to La Niño
Globalmean surface temperatures have increased 0.5-1.0°C since the late 19th century • The 20th century's 10 warmest years all occurred in the last 15 years of the century Why does this matter? (important!) • Such an increase continues. The best scientific estimate is that • global mean temperature will increase between 1.4 and 5.8 degrees C • over the next century as a result of increases in atmospheric CO2and • other greenhouse gases. This kind of increase in global temperature • would cause significant rise in average sea-level (0.09-0.88 meters), • and other severe consequences • Mean increase means that many regions increases much higher, and these regions • have problems in terms of extreme heat, drought, flood.
1979 2003
Important point of this slide • Although global mean surface has been warming up, for each region the change can be different! (can be no change, warming, or cooling) Class activity: find out your grandpa’s hometown and see how the temperature is changed there?
Antarctic Ice Shelves • Most common Ice Shelf: Giant floating platform of ice formed from glaciers located along coastlines • 50-600 meters thick • Can last for thousands of years • 10 major ice shelves in Antarctica
Then and Now • Temperature rises have also led to the expansion of species ranges in Antarctica. • “Long term monitoring of continental Antarctic terrestrial vegetation is crucial for accurate measurement and predictions of vegetation dynamics in response to future temperature regimes around the world”
Video: Antarctic Wilkins Ice Shelf Collapse • http://www.youtube.com/watch?v=poKX6OnehTc
The “Keeling curve,” a long-term record of atmospheric CO2 concentration measured at the Mauna Loa Observatory (Keeling et al.). Although the annual oscillations represent natural, seasonal variations, the long-term increase means that concentrations are higher than they have been in 400,000 years. Graphic courtesy of NASA’s Earth Observatory.
CO2 Unit atmospheric concentrations of CO2 in units of parts per million by volume (ppmv). Each ppmv represents 2.13 X10¹⁵ grams, or 2.13 petagrams of carbon (PgC) in the atmosphere Atmospheric CO2 concentrations rose from 288 ppmv in 1850 to 369.5 ppmv in 2000, for an increase of 81.5 ppmv, or 174 PgC. In other words, about 40% (174/441.5) of the additional carbon has remained in the atmosphere, while the remaining 60% has been transferred to the oceans and terrestrial biosphere. http://www.esrl.noaa.gov/gmd/ccgg/trends/
Table 1: Composition of the Atmosphere Percentage by Volume Gas Nitrogen 78.08 Oxygen 20.95 Argon 0.93 Trace Gases Carbon dioxide 0.038 Methane 0.00017 Ozone 0.000004 Chlorofluorocarbons 0.00000002 Water vapor Highly variable (0-4%)
Greenhouse Gases • Carbon Dioxide • Methane • Nitrous Oxide • CFCs (Chlorofluorocarbons) • Others Water vapor is one greenhouse house gas (GHG) In fact, it is the most abundant GHG
The early Greeks considered "air" to be one of four elementary substances; along with earth, fire, and water, air was viewed as a fundamental component of the universe. By the early 1800s, however, scientists such as John Dalton recognized that the atmosphere was in fact composed of several chemically distinct gases, which he was able to separate and determine the relative amounts of within the lower atmosphere. He was easily able to discern the major components of the atmosphere: nitrogen, oxygen, and a small amount of something incombustible, later shown to be argon. The development of the spectrometer in the 1920s allowed scientists to find gases that existed in much smaller concentrations in the atmosphere, such as ozone and carbon dioxide. The concentrations of these gases, while small, varied widely from place to place. In fact, atmospheric gases are often divided up into the major, constant components and the highly variable components, as listed below:
Although both nitrogen and oxygen are essential to human life on the planet, they have little effect on weather and other atmospheric processes. The variable components, which make up far less than 1 percent of the atmosphere, have a much greater influence on both short-term weather and long-term climate. For example, variations in water vapor in the atmosphere are familiar to us as relative humidity. Water vapor (H2O), CO2, CH4, N2O, and SO2all have an important property: they absorb heat emitted by the earth and thus warm the atmosphere, creating what we call the "greenhouse effect." Without these so-called greenhouse gases, the surface of the earth would be about 30 degrees Celsius cooler - too cold for life to exist as we know it. Global warming, on the other hand, is a separate process that can be caused by increased amounts of greenhouse gases in the atmosphere.
The Greenhouse Effect (Important concept) www.eecs.umich.edu/mathscience/funexperiments/agesubject/lessons/images/diagrampage.html
Greenhouse gases (important!) CO2 CH4 N2O (Nitrous Oxiode, so called “laughing gas”) CFC O3 H2O by the early 21st century, N2O had become nearly as important a greenhouse gas as methane. Their best guess was 0.7°C for N2O, and 0.3°C for methane. Wang et al. (1976).