Download
1 / 1
10 likes | 136 Vues
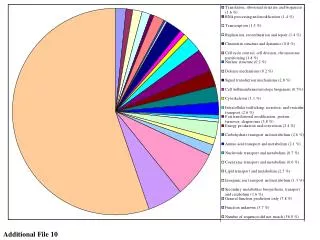
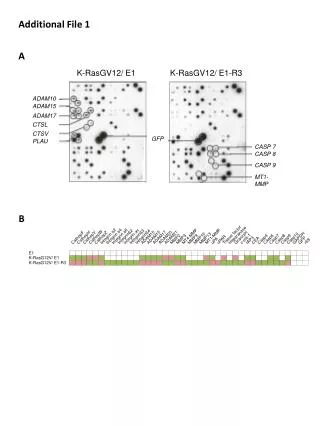
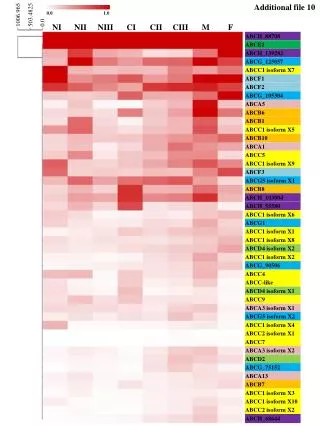
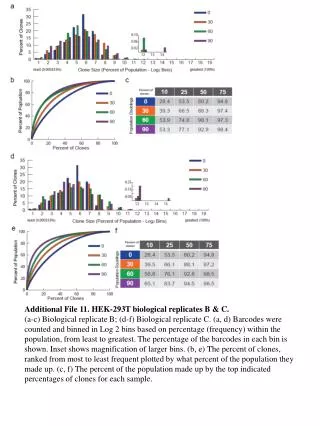
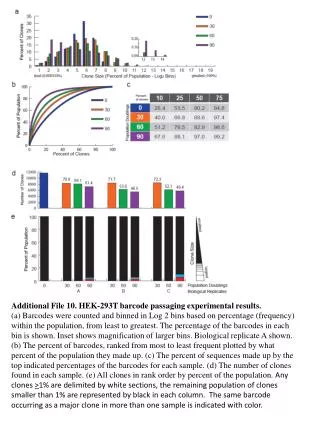
This experimental study examines the barcode frequency distribution within HEK-293T cell populations after passaging. We categorized barcodes into Log2 bins based on their abundance, presenting both the overall percentage and the rank order from most to least frequent. Visuals include magnified views of substantial bins, the frequency distribution of dominant barcodes, sample comparison graphs, and detailed summaries of clone representation. Clones exceeding 1% are highlighted for clarity, with shared barcodes across different samples indicated by color coding.

E N D
Additional File 10. HEK-293T barcode passaging experimental results. (a) Barcodes were counted and binned in Log 2 bins based on percentage (frequency) within the population, from least to greatest. The percentage of the barcodes in each bin is shown. Inset shows magnification of larger bins. Biological replicate A shown. (b) The percent of barcodes, ranked from most to least frequent plotted by what percent of the population they made up. (c) The percent of sequences made up by the top indicated percentages of the barcodes for each sample. (d) The number of clones found in each sample. (e) All clones in rank order by percent of the population. Any clones >1% are delimited by white sections, the remaining population of clones smaller than 1% are represented by black in each column. The same barcode occurring as a major clone in more than one sample is indicated with color.